Draft Final Report Acwa-08-05 - Continuation Of Lower Nushagak River Fecal Coliform And Water Quality Assessment - Alaska Department Of Environmental Conservation - 2008 Page 12
ADVERTISEMENT
 1
1 2
2 3
3 4
4 5
5 6
6 7
7 8
8 9
9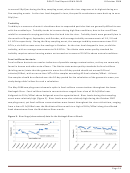 10
10 11
11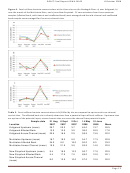 12
12 13
13 14
14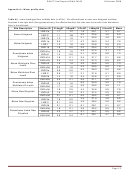 15
15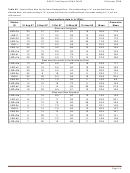 16
16 17
17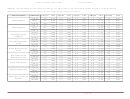 18
18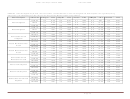 19
19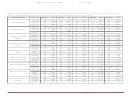 20
20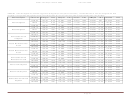 21
21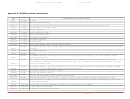 22
22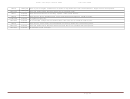 23
23DRAFT Final Report ACWA-08-05
8 October 2008
Figure 4.
Fecal coliform bacteria concentrations at the three sites on the Nushagak River: a) near Koliganek, b)
near the mouth of the Mulchatna River, and c) near New Stuyahok. FC concentrations from three upstream
samples (affected bank, mid-channel and unaffected bank) were averaged and the mid-channel and unaffected
bank samples were averaged for the across channel sites.
Table 2.
Fecal coliform bacteria concentrations in fc/100ml by site as compared to upriver and cross channel
control sites. The affected bank site is directly downriver from a potential input of fecal coliform. Upstream sites
are upriver of the potential input; across channel sites are across the channel from potential inputs.
Sample date
21 Aug
6 Sept
2 Oct
14 May
10 June
Location
2007
2007
2007
2008
2008
Mean
25.7
20.3
3.7
64.0
13.7
25.5
Koliganek Upstream (mean)
13.0
12.0
3.0
36.0
24.0
17.6
Koliganek Affected Bank
20.0
16.5
2.5
58.5
13.5
22.2
Koliganek Across Channel (mean)
18.7
18.3
5.0
54.7
17.3
22.8
Mulchatna Upstream (mean)
34.0
9.0
16.0
50.0
6.0
23.0
Mulchatna Affected Bank
15.5
21.0
3.5
55.5
14.5
22.0
Mulchatna Across Channel (mean)
9.4
16.0
13.3
56.7
17.0
22.5
New Stuyahok Upstream (mean)
5.4
17.0
7.0
69.0
12.0
22.1
New Stuyahok Affected Bank
New Stuyahok Across Channel
8.0
13.5
10.0
57.0
12.5
20.2
(mean)
Page 12
ADVERTISEMENT
0 votes
Related Articles
Related forms

 Vt Dec Underground Storage Tank Program Noav Response Form - Department Of Environmental Conservation
Legal
Vt Dec Underground Storage Tank Program Noav Response Form - Department Of Environmental Conservation
Legal
 Non-resident Sporting License Application - New York State Department Of Environmental Conservation
Legal
Non-resident Sporting License Application - New York State Department Of Environmental Conservation
Legal
 Report - Electric, Hydro-electric And Water Power Companies - Pennsylvania Department Of Revenue") Instructions For Rct-112 - Gross Receipts Tax (grt) Report - Electric, Hydro-electric And Water Power Companies - Pennsylvania Department Of Revenue
Financial
Instructions For Rct-112 - Gross Receipts Tax (grt) Report - Electric, Hydro-electric And Water Power Companies - Pennsylvania Department Of Revenue
Financial


Related Categories
Parent category: Legal