Federal Funds For Research And Development: Fiscal Years 2009-11 - National Service Foundation Page 205
ADVERTISEMENT
 1
1  2
2  3
3  4
4  5
5  6
6  7
7  8
8  9
9 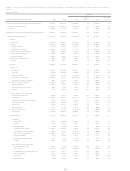 10
10 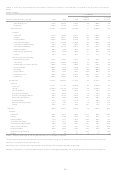 11
11 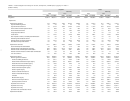 12
12 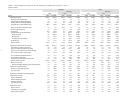 13
13 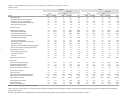 14
14 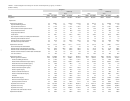 15
15 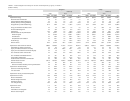 16
16 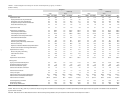 17
17  18
18 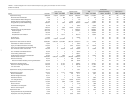 19
19 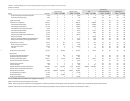 20
20 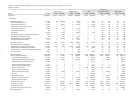 21
21 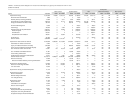 22
22 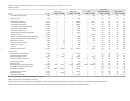 23
23 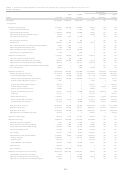 24
24 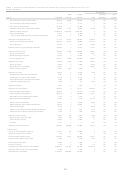 25
25  26
26  27
27 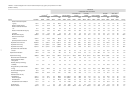 28
28 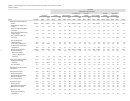 29
29  30
30 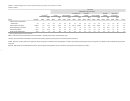 31
31 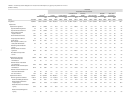 32
32 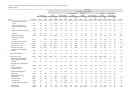 33
33 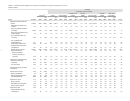 34
34 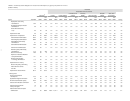 35
35 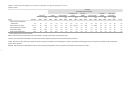 36
36 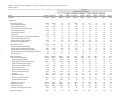 37
37 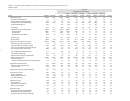 38
38 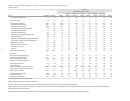 39
39 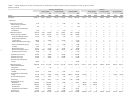 40
40 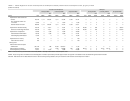 41
41 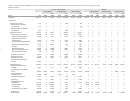 42
42 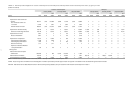 43
43 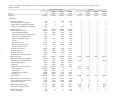 44
44 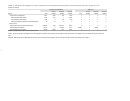 45
45 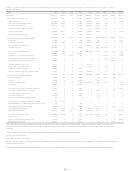 46
46 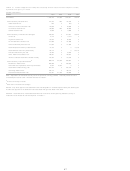 47
47  48
48 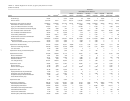 49
49 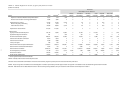 50
50 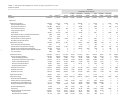 51
51 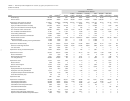 52
52 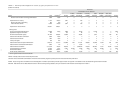 53
53 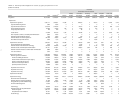 54
54 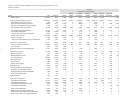 55
55 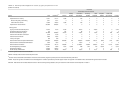 56
56  57
57 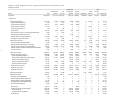 58
58 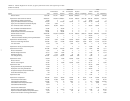 59
59 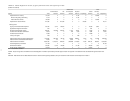 60
60 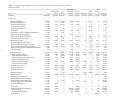 61
61 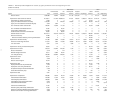 62
62 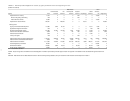 63
63  64
64 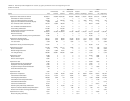 65
65 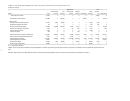 66
66 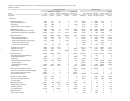 67
67 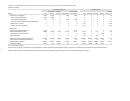 68
68 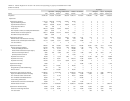 69
69 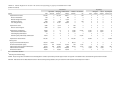 70
70 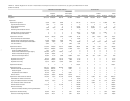 71
71 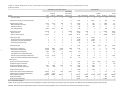 72
72 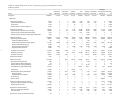 73
73 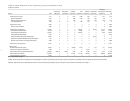 74
74 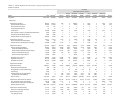 75
75 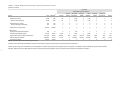 76
76  77
77  78
78 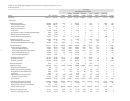 79
79 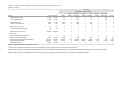 80
80  81
81 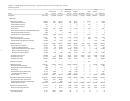 82
82 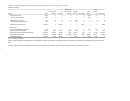 83
83 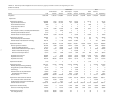 84
84 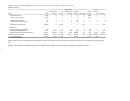 85
85 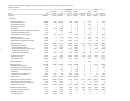 86
86 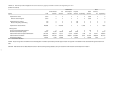 87
87 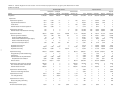 88
88 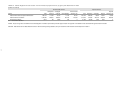 89
89 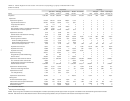 90
90 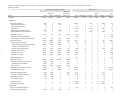 91
91 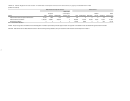 92
92 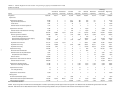 93
93 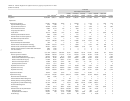 94
94 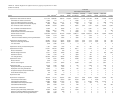 95
95 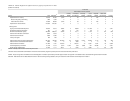 96
96 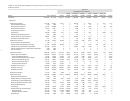 97
97 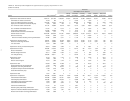 98
98 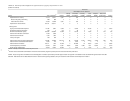 99
99 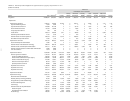 100
100 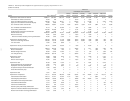 101
101 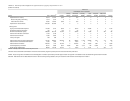 102
102 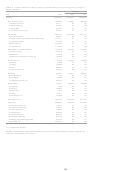 103
103 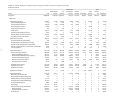 104
104 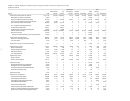 105
105 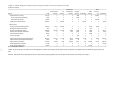 106
106  107
107 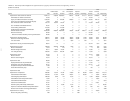 108
108  109
109 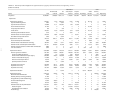 110
110  111
111 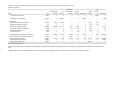 112
112 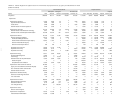 113
113 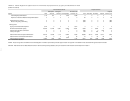 114
114 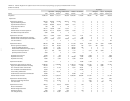 115
115 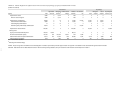 116
116 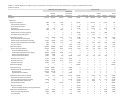 117
117 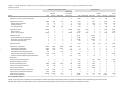 118
118 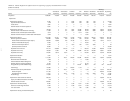 119
119 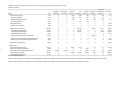 120
120 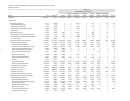 121
121 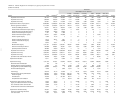 122
122 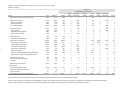 123
123  124
124 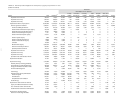 125
125 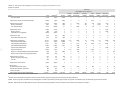 126
126 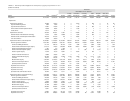 127
127 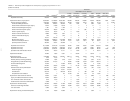 128
128 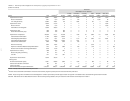 129
129 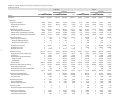 130
130 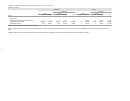 131
131 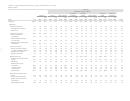 132
132 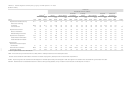 133
133 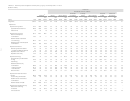 134
134 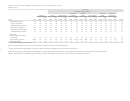 135
135 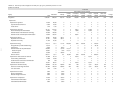 136
136 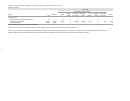 137
137 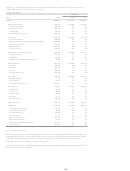 138
138  139
139 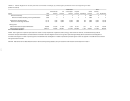 140
140 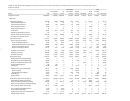 141
141  142
142 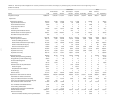 143
143 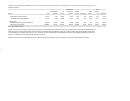 144
144 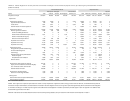 145
145 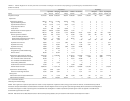 146
146 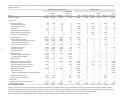 147
147 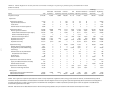 148
148  149
149 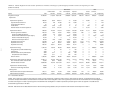 150
150 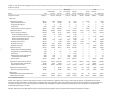 151
151  152
152 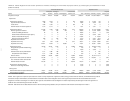 153
153 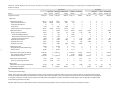 154
154 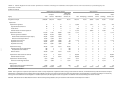 155
155 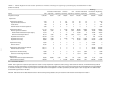 156
156 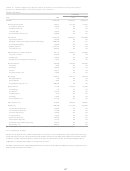 157
157  158
158 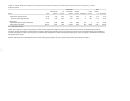 159
159 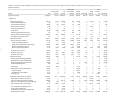 160
160 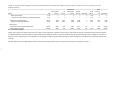 161
161 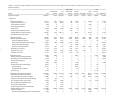 162
162 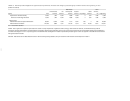 163
163 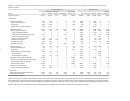 164
164 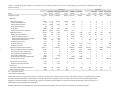 165
165 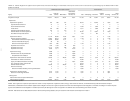 166
166 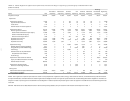 167
167 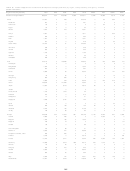 168
168 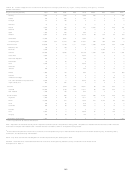 169
169 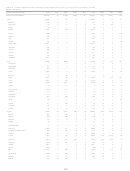 170
170 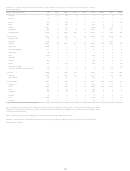 171
171 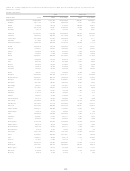 172
172 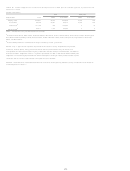 173
173 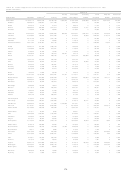 174
174  175
175 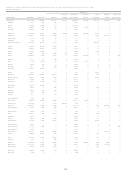 176
176  177
177 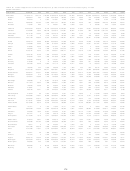 178
178  179
179  180
180  181
181 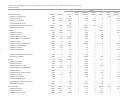 182
182 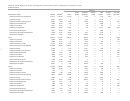 183
183 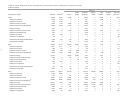 184
184 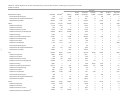 185
185 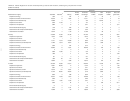 186
186 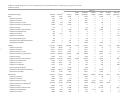 187
187 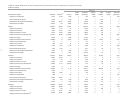 188
188 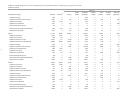 189
189 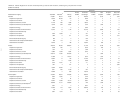 190
190 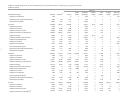 191
191 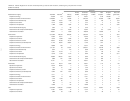 192
192 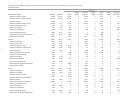 193
193 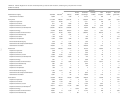 194
194 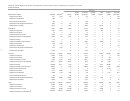 195
195 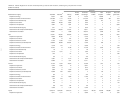 196
196 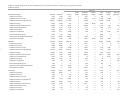 197
197 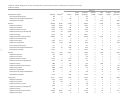 198
198 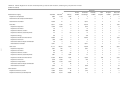 199
199 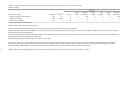 200
200  201
201 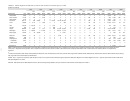 202
202 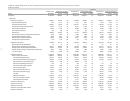 203
203 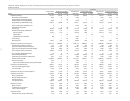 204
204 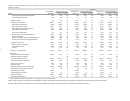 205
205 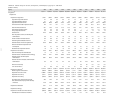 206
206  207
207 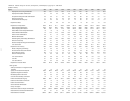 208
208 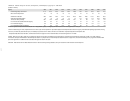 209
209 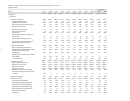 210
210 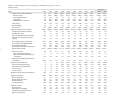 211
211 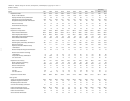 212
212 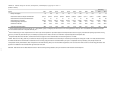 213
213  214
214 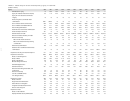 215
215 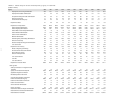 216
216 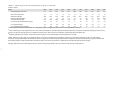 217
217  218
218 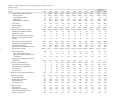 219
219 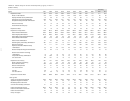 220
220 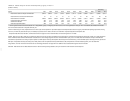 221
221 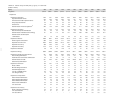 222
222 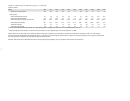 223
223 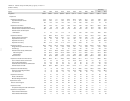 224
224 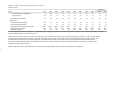 225
225 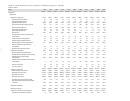 226
226 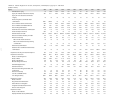 227
227  228
228 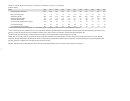 229
229 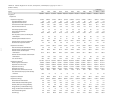 230
230 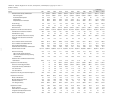 231
231 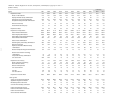 232
232 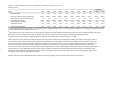 233
233 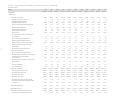 234
234 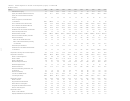 235
235 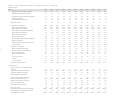 236
236 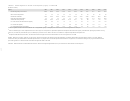 237
237 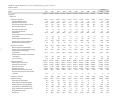 238
238 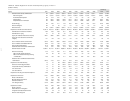 239
239 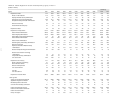 240
240 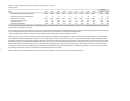 241
241 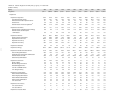 242
242 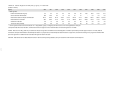 243
243 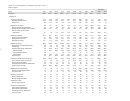 244
244 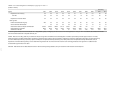 245
245 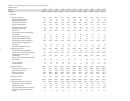 246
246 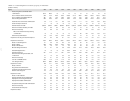 247
247 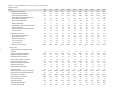 248
248 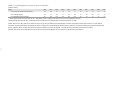 249
249 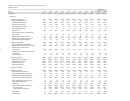 250
250 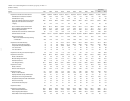 251
251 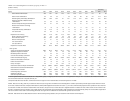 252
252 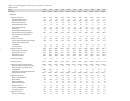 253
253 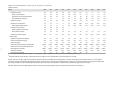 254
254 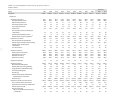 255
255 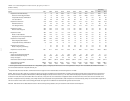 256
256 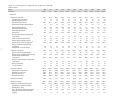 257
257 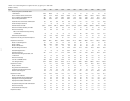 258
258 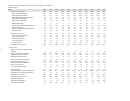 259
259 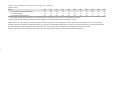 260
260 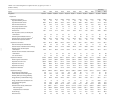 261
261 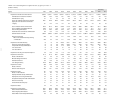 262
262 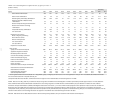 263
263 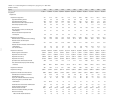 264
264 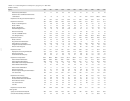 265
265 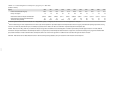 266
266 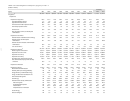 267
267 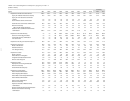 268
268 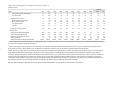 269
269 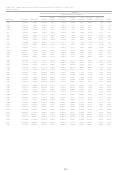 270
270 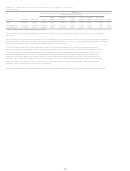 271
271  272
272  273
273 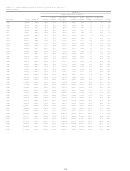 274
274 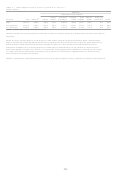 275
275 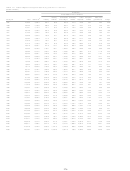 276
276 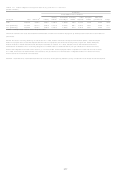 277
277 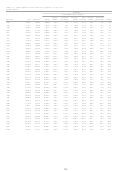 278
278 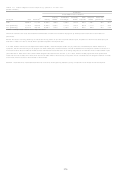 279
279 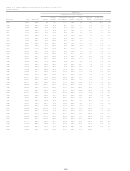 280
280 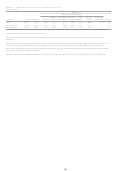 281
281  282
282 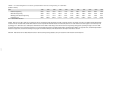 283
283 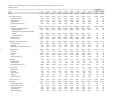 284
284 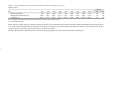 285
285 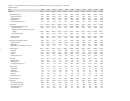 286
286  287
287 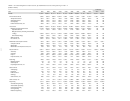 288
288 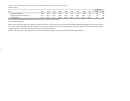 289
289 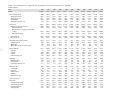 290
290 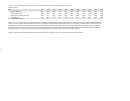 291
291 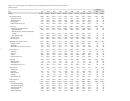 292
292 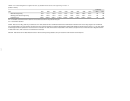 293
293 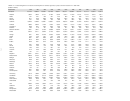 294
294 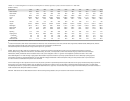 295
295 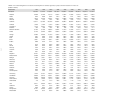 296
296 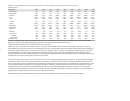 297
297 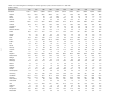 298
298 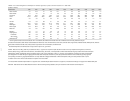 299
299 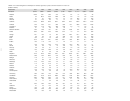 300
300 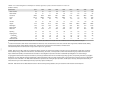 301
301  302
302  303
303  304
304  305
305  306
306  307
307  308
308  309
309  310
310  311
311  312
312  313
313  314
314 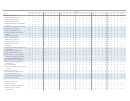 315
315 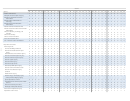 316
316 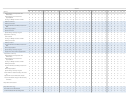 317
317 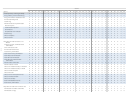 318
318 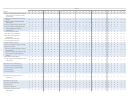 319
319 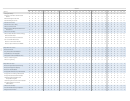 320
320 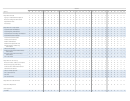 321
321 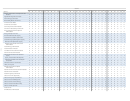 322
322 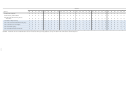 323
323  324
324  325
325  326
326  327
327 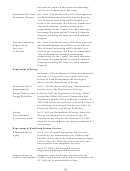 328
328 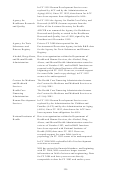 329
329 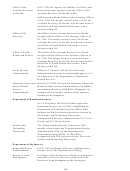 330
330 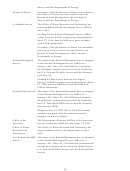 331
331  332
332  333
333  334
334  335
335 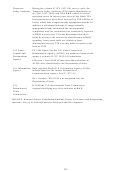 336
336  337
337  338
338  339
339  340
340 TABLE 88. Federal obligations for research and development to intramural performers for personnel costs, by agency: FY 2009–11
(Dollars in thousands)
Preliminary
Total intramural
Total intramural
Total intramural
Personnel costs (2009)
Personnel costs (2010)
Personnel costs (2011)
R&D (2009)
R&D (2010)
R&D (2011)
Agency
Amount % of total
Amount % of total
Amount % of total
Occupational Safety and Health Administration
3,790
3,790
100
4,729
4,729
100
4,800
4,800
100
Pension Benefit Guaranty Corp.
606
606
100
617
617
100
629
629
100
Department of State
764
764
100
2,941
717
24
2,941
717
24
Department of Transportation
226,451
99,701
44
260,545
100,572
39
273,532
105,824
39
Federal Aviation Administration
76,055
58,409
77
104,149
58,284
56
114,540
59,396
52
Federal Highway Administration
49,734
15,011
30
64,047
15,511
24
64,047
16,431
26
Federal Motor Carrier Safety Administration
3,300
2,550
77
2,563
2,563
100
2,382
2,382
100
Federal Railroad Administration
12,003
3,484
29
25,751
3,589
14
29,618
3,690
12
Federal Transit Administration
561
561
100
1,051
1,051
100
1,218
1,218
100
National Highway Traffic Safety Administration
57,628
10,200
18
42,870
8,313
19
46,384
11,174
24
Office of the Secretary
13,965
3,618
26
6,972
5,511
79
6,624
5,808
88
Pipeline and Hazardous Materials Safety Administration
2,068
1,088
53
1,729
1,050
61
1,694
1,100
65
Research and Innovative Technology Administration
11,137
4,780
43
11,414
4,701
41
7,025
4,625
66
Department of the Treasury
62,698
43,116
69
65,444
46,963
72
68,284
46,895
69
Bureau of Engraving and Printing
2,950
1,159
39
1,086
455
42
3,884
295
8
Internal Revenue Service
59,648
41,857
70
64,258
46,408
72
64,300
46,500
72
U.S. Mint
100
100
100
100
100
100
100
100
100
Department of Veterans Affairs
510,000
260,213
51
581,401
296,681
51
590,000
301,070
51
Other agencies
Agency for International Development
10,626
3,515
33
6,290
2,421
38
6,416
2,469
38
Appalachian Regional Commission
*
*
100
*
*
100
*
*
100
Environmental Protection Agency
414,054
243,311
59
418,334
250,900
60
424,565
259,019
61
Federal Communications Commission
6,965
6,278
90
5,424
3,698
68
4,660
3,704
79
Federal Trade Commission
2,389
1,345
56
1,940
1,092
56
2,365
1,331
56
Library of Congress
794
585
74
1,149
884
77
1,316
958
73
National Aeronautics and Space Administration
916,335
453,224
49
885,639
437,404
49
963,226
483,703
50
National Archives and Records Administration
120
100
83
120
100
83
1,200
1,200
100
National Science Foundation
22,035
*
**
24,042
*
**
26,173
*
**
Nuclear Regulatory Commission
2,773
23
1
3,814
25
1
3,839
27
1
Smithsonian Institution
152,000
98,800
65
164,000
106,600
65
178,000
115,700
65
Social Security Administration
7,177
5,257
73
16,874
11,661
69
23,736
19,736
83
* = amount greater than $0 but less than $50,000; ** = amount greater than 0 but less than 0.5%.
NOTES: Only those agencies and subdivisions that had obligations in variables represented by this table appear in table. See appendix C for additional notes associated with agencies listed in this table.
SOURCE: National Science Foundation/National Center for Science and Engineering Statistics, Survey of Federal Funds for Research and Development: FY 2009–11.
ADVERTISEMENT
0 votes
Related Articles
Related forms
 Form 2070ac 0007 - Application And Computation Schedule For Claiming Delaware Research And Development Tax Credits - 2009
Financial
Form 2070ac 0007 - Application And Computation Schedule For Claiming Delaware Research And Development Tax Credits - 2009
Financial

 Form F-1196 Draft - Allocation For Research And Development Tax Credit For Florida Corporate Income/franchise Tax
Financial
Form F-1196 Draft - Allocation For Research And Development Tax Credit For Florida Corporate Income/franchise Tax
Financial


Related Categories
Parent category: Legal