Early Childhood Program Participation, From The National Household Education Surveys Program Of 2012 - U.s. Department Of Education Page 15
ADVERTISEMENT
 1
1 2
2 3
3 4
4 5
5 6
6 7
7 8
8 9
9 10
10 11
11 12
12 13
13 14
14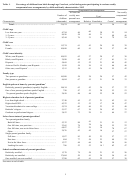 15
15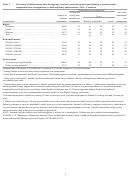 16
16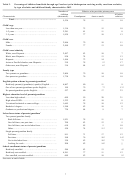 17
17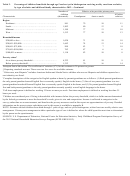 18
18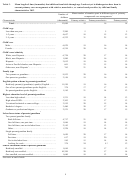 19
19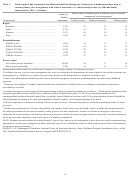 20
20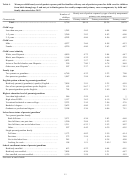 21
21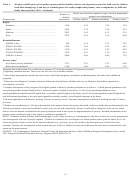 22
22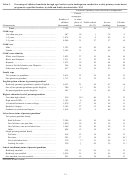 23
23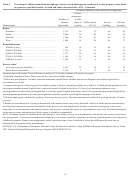 24
24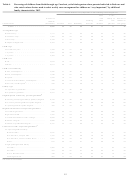 25
25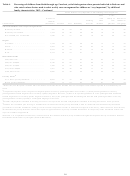 26
26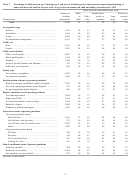 27
27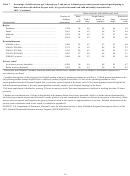 28
28 29
29 30
30 31
31 32
32 33
33 34
34 35
35 36
36 37
37 38
38 39
39 40
40 41
41 42
42 43
43 44
44 45
45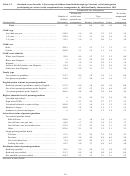 46
46 47
47 48
48 49
49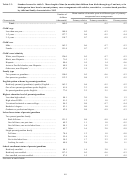 50
50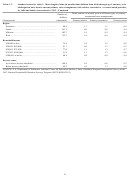 51
51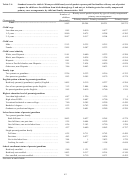 52
52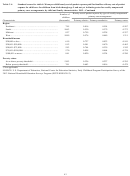 53
53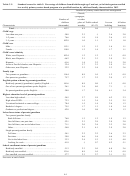 54
54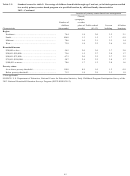 55
55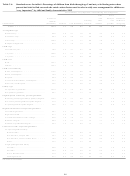 56
56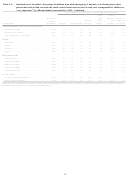 57
57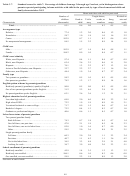 58
58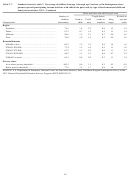 59
59Table 1.
Percentage of children from birth through age 5 and not yet in kindergarten participating in various weekly
nonparental care arrangements, by child and family characteristics: 2012
Nonparental care arrangement
At least one
No weekly
Number of
weekly non-
nonparental
1
Type
children
parental care
care
2
Characteristic
(thousands)
arrangement
Relative Nonrelative
Center
arrangement
Total…………………………………………………
21,674
60
42
24
56
40
Child’s age
60
Less than one year…………………………………………
4,794
46
30
23
54
49
1–2 years…………………………………………………
8,636
54
31
40
46
8,244
76
31
16
3–5 years…………………………………………………
79
24
Child’s sex
43
Male…………………...…………………………………
11,274
61
24
55
39
10,400
60
41
24
Female………………..……………………………………
57
40
Child’s race/ethnicity
White, non-Hispanic………………………………………
10,893
62
37
28
57
38
47
Black, non-Hispanic………………………………………
2,890
69
17
61
31
5,469
55
52
21
Hispanic…………………………………………………
49
45
Asian or Pacific Islander, non-Hispanic……………………
1,109
54
36
15
66
46
3
41
Other race, non-Hispanic
…………………………………
1,315
58
26
55
42
Family type
16,980
58
38
24
Two parents or guardians…………………………………
57
42
One parent or guardian……………………………………
4,694
67
55
21
54
33
4
English spoken at home by parents/guardians
42
Both/only parent(s)/guardian(s) speak(s) English…………
18,434
63
24
57
37
790
47
53
20
One of two parents/guardians speaks English……………
53
53
No parent/guardian speaks English………………………
2,450
48
44
22
50
52
Highest education level of parents/guardians
2,740
45
57
21
Less than high school………………………………………
42
55
53
High school/GED…………………………………………
4,322
53
17
50
47
46
Vocational/technical or some college………………………
5,974
60
23
53
40
5,187
67
36
24
Bachelor’s degree…………………………………………
62
33
29
Graduate or professional degree……………………………
3,452
73
31
64
27
5
Labor force status of parents/guardians
Two-parent/guardian family
41
Both full time……………………………………………
5,332
88
31
51
12
38
One full time, one part time……………………………
2,365
78
26
55
22
6,407
33
29
14
One full time, one not in labor force……………………
70
67
45
Other……………………………………………..……
2,876
43
16
57
57
Single-parent/guardian family
1,957
83
50
23
Full time…………………………………………………
57
17
58
Part time…………………………………………………
804
77
23
48
23
1,227
44
66
20
Not in the labor force……………………………………
50
56
706
53
53
14 !
Looking for work………………………………………
62
47
School enrollment status of parents/guardians
1,370
74
58
21
Both/only enrolled…………………………………………
53
26
17,604
59
41
24
Both/only not enrolled……………………………………
56
41
41
One enrolled, one not enrolled……………………………
2,700
62
22
57
38
See notes at end of table.
5
ADVERTISEMENT
0 votes
Related Articles
Related forms


Related Categories
Parent category: Legal