Early Childhood Program Participation, From The National Household Education Surveys Program Of 2012 - U.s. Department Of Education Page 49
ADVERTISEMENT
 1
1 2
2 3
3 4
4 5
5 6
6 7
7 8
8 9
9 10
10 11
11 12
12 13
13 14
14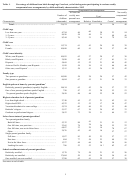 15
15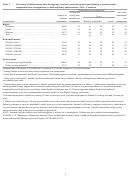 16
16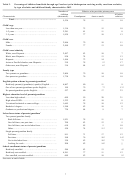 17
17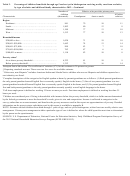 18
18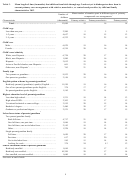 19
19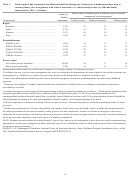 20
20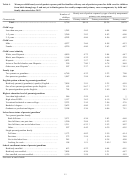 21
21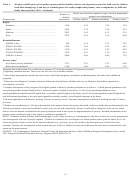 22
22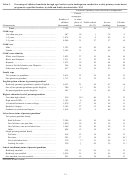 23
23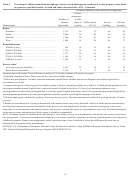 24
24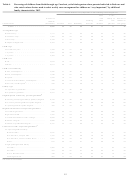 25
25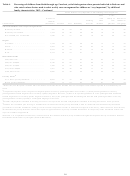 26
26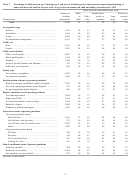 27
27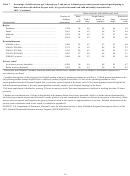 28
28 29
29 30
30 31
31 32
32 33
33 34
34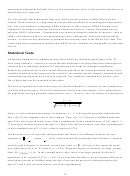 35
35 36
36 37
37 38
38 39
39 40
40 41
41 42
42 43
43 44
44 45
45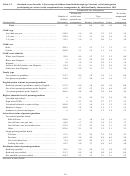 46
46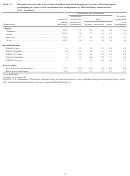 47
47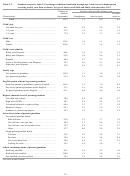 48
48 49
49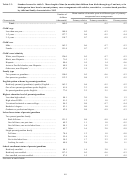 50
50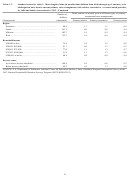 51
51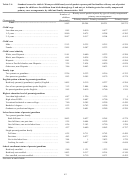 52
52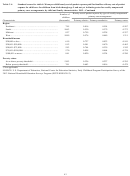 53
53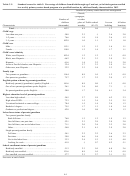 54
54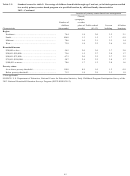 55
55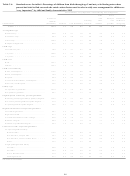 56
56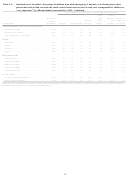 57
57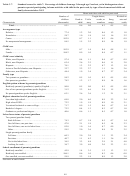 58
58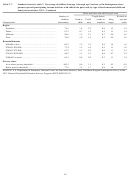 59
59Table C-2.
Standard errors for table 2: Percentage of children from birth through age 5 and not yet in kindergarten
receiving weekly care from a relative, by type of relative and child and family characteristics:
2012—Continued
Relative who provides primary care
Number of
All other
children
Grandparent
Aunt or uncle
relatives
Characteristic
(thousands)
Region
Northeast…………………………………………………
69.2
2.7
2.3
2.4
South………………………...……………………………
97.9
2.0
1.7
1.2
Midwest………...…………………………………………
68.7
2.8
2.4
1.9
West………………………………………..……………
103.1
2.7
1.6
2.4
Household income
$20,000 or less……………………………………………
68.1
2.8
2.6
1.9
$20,001–$50,000…………………………………………
74.7
2.5
2.1
1.9
$50,001–$75,000…………………………………………
49.5
3.2
1.7
2.6
$75,001–$100,000………………………………………
52.6
2.6
1.6
1.8
$100,001 or more…………………………………………
60.1
2.8
2.1
2.0
Poverty status
At or above poverty threshold……………………………
121.0
1.4
1.1
1.1
Below poverty threshold…………………………………
80.1
2.7
2.3
2.2
† Not applicable.
SOURCE: U.S. Department of Education, National Center for Education Statistics, Early Childhood Program Participation Survey
of the 2012 National Household Education Surveys Program (ECPP-NHES:2012).
39
ADVERTISEMENT
0 votes
Related Articles
Related forms


Related Categories
Parent category: Legal