Exploring Pie Charts Worksheet Page 2
ADVERTISEMENT
 1
1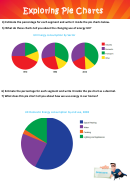 2
2Exploring Pie Charts
4) Estimate the percentage for each segment and write it inside the pie charts below.
5) What do these charts tell you about the changing use of energy UK?
UK Energy consumption by Sector
6) Estimate the percentage for each segment and write it inside the pie chart as a decimal.
7) What does this pie chart tell you about how we use energy in our homes?
UK Domestic Energy consumption by end use, 2008
ADVERTISEMENT
0 votes
Related Articles
Related forms


Related Categories
Parent category: Education