Instructions For Form 82-053 - Motor Fuel Retailers Gallons Annual Report - 2011 Page 7
ADVERTISEMENT
 1
1 2
2 3
3 4
4 5
5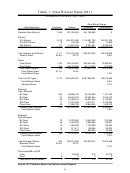 6
6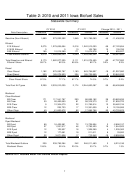 7
7Table 2: 2010 and 2011 Iowa Biofuel Sales
Statewide Summary
CY 2010
CY 2011
Change 2010 - 2011
Data Description
Locations
Gallons
Locations
Gallons
Locations
Gallons
Gasoline (Non-Ethanol)
1,890
273,222,302
1,845
261,786,063
-45
-11,436,239
Ethanol
E10 Ethanol
2,075
1,279,635,654
2,016
1,242,513,000
-59
-37,122,654
E15/20 Ethanol
0
0
10
105,766
10
105,766
E85 Ethanol
165
10,019,369
171
10,674,576
6
655,207
Total Ethanol Gallons
2,079
1,289,655,023
2,023
1,253,293,342
-56
-36,361,681
Total Gasoline and Ethanol
2,173
1,562,877,325
2,111
1,515,079,405
-62
-47,797,920
Ethanol Share
95.7%
82.5%
95.8%
82.7%
0.2%
0.2%
Diesel
Clear Diesel
1,182
575,052,787
1,163
543,794,807
-19
-31,257,980
Dyed Diesel
333
165,079,923
324
185,725,855
-9
20,645,932
Total Diesel Gallons
1,218
740,132,710
1,190
729,520,662
-28
-10,612,048
Clear Diesel Share
97.0%
77.7%
97.7%
74.5%
0.7%
-3.2%
Total Fuel All Types
2,209
2,303,010,035
2,174
2,244,600,067
-35
-58,409,968
Biodiesel
Clear Biodiesel
B2 Clear
171
117,541,797
200
86,858,162
29
-30,683,635
B5 Clear
30
26,462,650
61
58,318,373
31
31,855,723
B10 Clear
9
12,304,070
22
51,766,814
13
39,462,744
B20 Clear
12
235,733
17
12,391,639
5
12,155,906
Other Clear
40
61,600,672
92
17,896,796
52
-43,703,876
Subtotal Clear Biodiesel
205
218,144,922
204
227,231,784
-1
9,086,862
Biodiesel
Dyed Biodiesel
B2 Dyed
69
16,425,961
72
13,729,804
3
-2,696,157
B5 Dyed
27
1,251,917
46
2,796,420
19
1,544,503
B10 Dyed
12
123,937
16
1,329,299
4
1,205,362
B20 Dyed
12
177,691
18
211,611
6
33,920
Other Dyed
32
3,671,836
17
712,542
-15
-2,959,294
Subtotal Dyed Biodiesel
102
21,651,342
102
18,779,676
0
-2,871,666
Total Biodiesel Gallons
239
239,796,264
242
246,011,460
3
6,215,196
Biodiesel Share
19.6%
32.4%
20.3%
33.7%
0.7%
1.3%
Source: 2011 Retailers Motor Fuel Gallons Annual Reports
7
ADVERTISEMENT
0 votes
Related Articles
Related forms


 Form 0405-533i - Instructions For Form 530 Alaska Motor Fuel Tax Return For Diesel - State Of Alaska
Financial
Form 0405-533i - Instructions For Form 530 Alaska Motor Fuel Tax Return For Diesel - State Of Alaska
Financial

 Instructions For Form 8609 - Low-income Housing Credit Allocation And Certification - 2011
Financial
Instructions For Form 8609 - Low-income Housing Credit Allocation And Certification - 2011
Financial


Related Categories
Parent category: Financial