Pie Chart Worksheet Page 7
ADVERTISEMENT
 1
1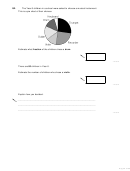 2
2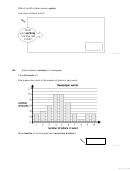 3
3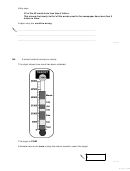 4
4 5
5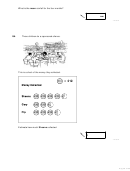 6
6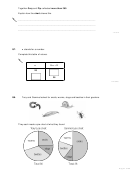 7
7 8
8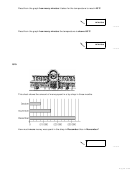 9
9 10
10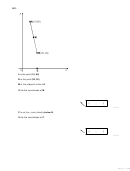 11
11 12
12 13
13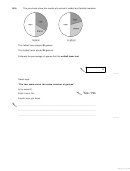 14
14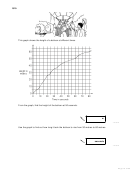 15
15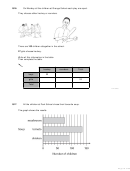 16
16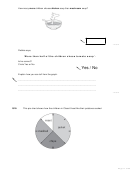 17
17 18
18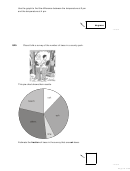 19
19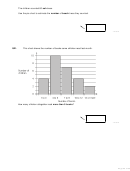 20
20 21
21 22
22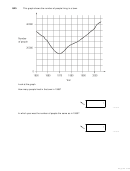 23
23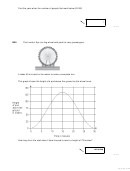 24
24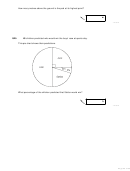 25
25 26
26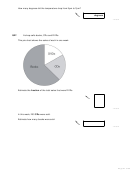 27
27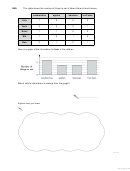 28
28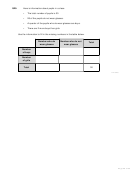 29
29 30
30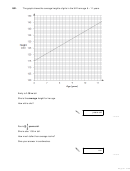 31
31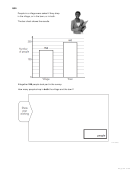 32
32 33
33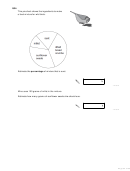 34
34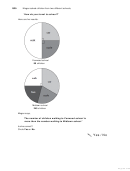 35
35 36
36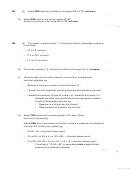 37
37 38
38 39
39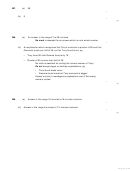 40
40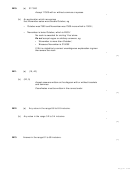 41
41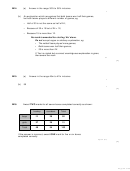 42
42 43
43 44
44 45
45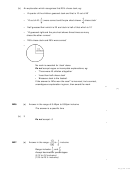 46
46 47
47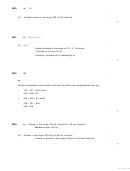 48
48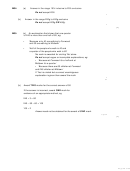 49
49 50
50Together Gary and Pip collected more than £60.
Explain how the chart shows this.
...............................................................................................................................
...............................................................................................................................
...............................................................................................................................
1 mark
n
Q7.
stands for a number.
Complete this table of values.
n
n
5
– 2
20
38
2 marks
Q8.
Tony and Gemma looked for snails, worms, slugs and beetles in their gardens.
They each made a pie chart of what they found.
Page 7 of 50
ADVERTISEMENT
0 votes
Related Articles
Related forms


Related Categories
Parent category: Education