6.5 Analyzing And Sketching Graphs Worksheet Page 2
ADVERTISEMENT
 1
1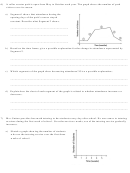 2
2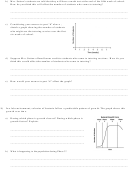 3
3 4
46) A roller coaster park is open from May to October each year. The graph shows the number of park
visitors over its season.
a) Segment l shows that attendance during the
opening days of the park's season stayed
constant. Describe what Segment 2 shows.
________________________________________
________________________________________
________________________________________
b) Based on the time frame, give a possible explanation for the change in attendance represented by
Segment 2.
_________________________________________________________________________________
_________________________________________________________________________________
c) Which segments of the graph show decreasing attendance? Give a possible explanation..
_________________________________________________________________________________
_________________________________________________________________________________
d) Explain how the slant of each segment of the graph is related to whether attendance increases or
decreases.
_________________________________________________________________________________
_________________________________________________________________________________
7) Mrs. Sutton provides free math tutoring to her students every day after school. No one comes to tutoring
sessions during the first week of school. Over the next two weeks, use of the tutoring service gradually
increases.
a) Sketch a graph showing the number of students
who use the tutoring service over the first three
weeks of school.
ADVERTISEMENT
0 votes
Related Articles
Related forms


Related Categories
Parent category: Education