6.5 Analyzing And Sketching Graphs Worksheet Page 4
ADVERTISEMENT
 1
1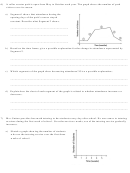 2
2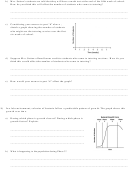 3
3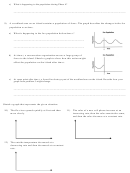 4
4What is happening to the population during Phase 4?
c)
_________________________________________________________________________________
9) A woodland area on an island contains a population of foxes. The graph describes the changes in the fox
population over time.
a) What is happening to the fox population before time t?
___________________________________________________
___________________________________________________
b) At time t, a conservation organization moves a large group of
foxes to the island. Sketch a graph to show how this action might
affect the population on the island after time t.
c)
At some point after time t, a forest fire destroys part of the woodland area on the island. Describe how your
graph from problem 5 might change.
_________________________________________________________________________________
_________________________________________________________________________________
Sketch a graph that represents the given situation.
10) The flu virus spreads quickly at first and then
11) The sales of a new cell phone increase at an
more slowly.
increasing rate, then the sales remain the same,
and then the sales decrease at a constant rate.
12) The outside temperature decreased at a
decreasing rate and then decreased at a constant
rate.
ADVERTISEMENT
0 votes
Related Articles
Related forms


Related Categories
Parent category: Education