6.5 Analyzing And Sketching Graphs Worksheet Page 3
ADVERTISEMENT
 1
1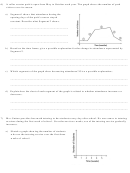 2
2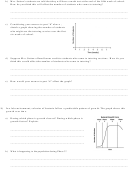 3
3 4
4b) Mrs. Sutton's students are told that they will have a math test at the end of the fifth week of school.
How do you think this will affect the number of students who come to tutoring?
_________________________________________________________________________________
_________________________________________________________________________________
c) Considering your answer to part “b” above ,
sketch a graph showing the number of students
who might use the tutoring service over the first
six weeks of school.
d) Suppose Mrs. Sutton offered bonus credit to students who came to tutoring sessions. How do you
think this would affect the number of students who come to tutoring?
_________________________________________________________________________________
_________________________________________________________________________________
e) How would your answer to part “d” affect the graph?
_________________________________________________________________________________
_________________________________________________________________________________
8) In a lab environment, colonies of bacteria follow a predictable pattern of growth. The graph shows this
growth over time.
a) During which phase is growth slowest? During which phase is
growth fastest? Explain.
___________________________________________________
___________________________________________________
___________________________________________________
b)
What is happening to the population during Phase 3?
_________________________________________________________________________________
_________________________________________________________________________________
ADVERTISEMENT
0 votes
Related Articles
Related forms


Related Categories
Parent category: Education