Numeracy Worksheet - Castlebrae Community High School - 2012 Page 37
ADVERTISEMENT
 1
1 2
2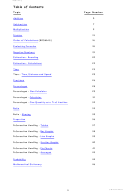 3
3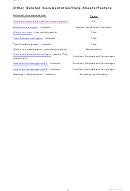 4
4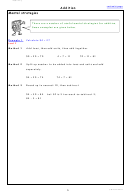 5
5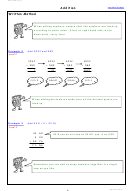 6
6 7
7 8
8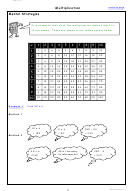 9
9 10
10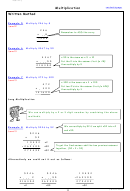 11
11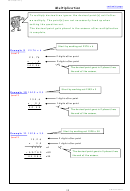 12
12 13
13 14
14 15
15 16
16 17
17 18
18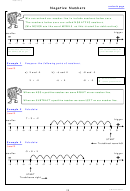 19
19 20
20 21
21 22
22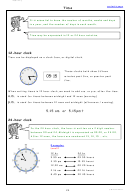 23
23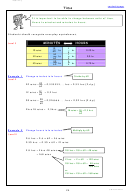 24
24 25
25 26
26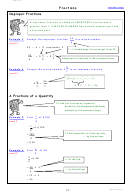 27
27 28
28 29
29 30
30 31
31 32
32 33
33 34
34 35
35 36
36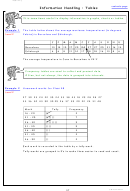 37
37 38
38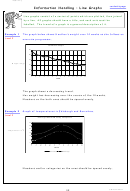 39
39 40
40 41
41 42
42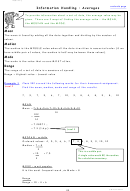 43
43 44
44 45
45 46
46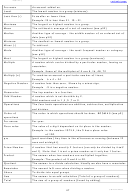 47
47FHS Numeracy
Information Handling : Tables
contents page
It is sometimes useful to display information in graphs, charts or tables.
Example 1
The table below shows the average maximum temperatures (in degrees
Level 2
Celsius) in Barcelona and Edinburgh.
J
F
M
A
M
J
J
A
S
O
N
D
Barcelona
13 14 15 17 20 24 27 27 25 21 16 14
Edinburgh
6
6
8
11
14
17
18
18
16
13 8
6
The average temperature in June in Barcelona is 24C
Frequency tables are used to collect and present data.
Often, but not always, the data is grouped into intervals.
Example 2 Homework marks for Class 4B
Level 2
27 30 23 24 22 35 24 33 38 43 18 29 28 28 27
33 36 30 43 50 30 25 26 37 35 20 22 24 31 48
Mark
Tally
Frequency
16 - 20
||
2
21 - 25
|||| ||
7
26 - 30
|||| ||||
9
31 - 35
||||
5
36 - 40
|||
3
41 - 45
||
2
46 - 50
||
2
Each mark is recorded in the table by a tally mark.
Tally marks are grouped in 5’s to make them easier to read and count.
37
L Watson 2012
ADVERTISEMENT
0 votes
Related Articles
Related forms


Related Categories
Parent category: Education