Numeracy Worksheet - Castlebrae Community High School - 2012 Page 42
ADVERTISEMENT
 1
1 2
2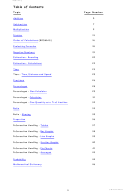 3
3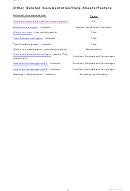 4
4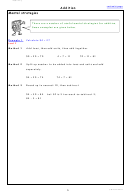 5
5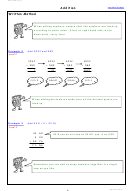 6
6 7
7 8
8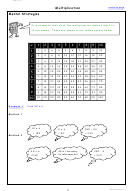 9
9 10
10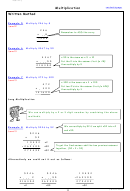 11
11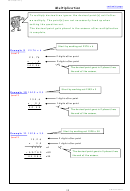 12
12 13
13 14
14 15
15 16
16 17
17 18
18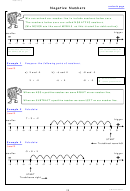 19
19 20
20 21
21 22
22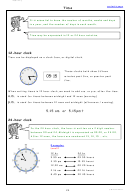 23
23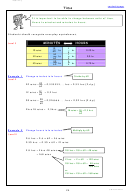 24
24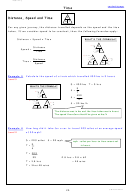 25
25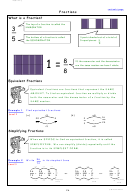 26
26 27
27 28
28 29
29 30
30 31
31 32
32 33
33 34
34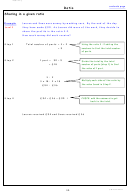 35
35 36
36 37
37 38
38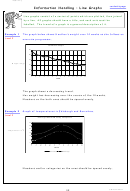 39
39 40
40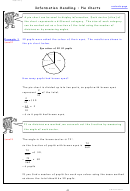 41
41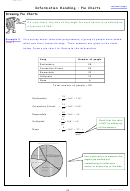 42
42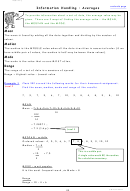 43
43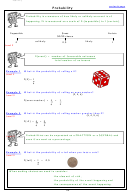 44
44 45
45 46
46 47
47FHS Numeracy
Information Handling : Pie Charts
contents page
Drawing Pie Charts
On a pie chart, the size of the angle for each sector is calculated as
a fraction of 360.
Statistics
Example 2 In a survey about television programmes, a group of people were asked
Level 3
what was their favourite soap. Their answers are given in the table
below. Draw a pie chart to illustrate the information.
Soap
Number of people
Eastenders
28
Coronation Street
24
Emmerdale
10
Hollyoaks
12
None
6
Total number of people = 80
28
Eastenders
=
360
126
80
24
Coronation Street
=
360
108
80
10
Emmerdale
=
360
45
80
Check that the total
12
Hollyoaks
=
360
54
is 360 by adding up
80
all the answers
6
None
=
+
360
27
80
o
360
Favourite Soap Operas
None
Hollyoaks
Use a protractor to measure the
Eastenders
angles you worked out
Emmerdale
remembering to label each
sector or draw a key at the side.
Coronation
Street
42
L Watson 2012
ADVERTISEMENT
0 votes
Related Articles
Related forms


Related Categories
Parent category: Education