Numeracy Worksheet - Castlebrae Community High School - 2012 Page 40
ADVERTISEMENT
 1
1 2
2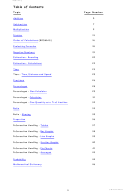 3
3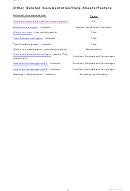 4
4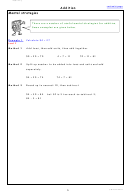 5
5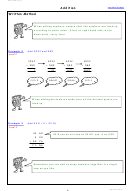 6
6 7
7 8
8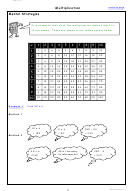 9
9 10
10 11
11 12
12 13
13 14
14 15
15 16
16 17
17 18
18 19
19 20
20 21
21 22
22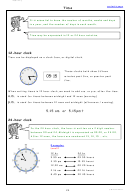 23
23 24
24 25
25 26
26 27
27 28
28 29
29 30
30 31
31 32
32 33
33 34
34 35
35 36
36 37
37 38
38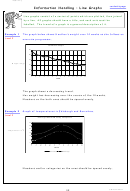 39
39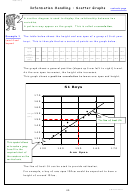 40
40 41
41 42
42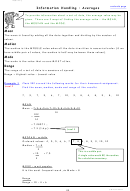 43
43 44
44 45
45 46
46 47
47FHS Numeracy
Information Handling : Scatter Graphs
contents page
A scatter diagram is used to display the relationship between two
variables.
A pattern may appear on the graph. This is called a correlation.
Example 1 The table below shows the height and arm span of a group of first year
Level 4 and
boys. This is then plotted as a series of points on the graph below.
beyond
Arm
Span
150
157
155
142
153
143
140
145
144
150
148
160
150
156
136
(cm)
Height
153
155
157
145
152
141
138
145
148
151
145
165
152
154
137
(cm)
The graph shows a general positive (slopes up from left to right) trend.
As the arm span increases, the height also increases.
This graph shows a positive correlation between arm span and height.
S1 Boys
1 7 0
1 6 5
1 6 0
1 5 5
Height
(cm)
1 5 0
The line of best fit.
1 4 5
1 4 0
1 3 5
This symbol allows
1 3 0
0
us to make a jump
1 3 0
1 4 0
1 5 0
1 6 0
1 7 0
from 0 to the
A rm Span
required start of
the numbers on the
vertical axis.
The line of best fit can be used to provide estimates.
For example, a boy of arm span 150cm would be expected to have a
height of around 151cm.
40
L Watson 2012
ADVERTISEMENT
0 votes
Related Articles
Related forms


Related Categories
Parent category: Education