Numeracy Worksheet - Castlebrae Community High School - 2012 Page 41
ADVERTISEMENT
 1
1 2
2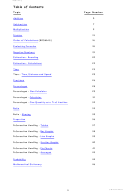 3
3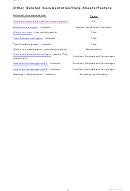 4
4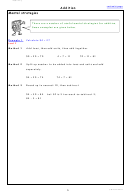 5
5 6
6 7
7 8
8 9
9 10
10 11
11 12
12 13
13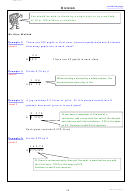 14
14 15
15 16
16 17
17 18
18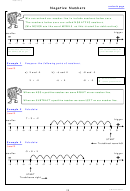 19
19 20
20 21
21 22
22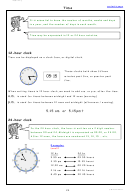 23
23 24
24 25
25 26
26 27
27 28
28 29
29 30
30 31
31 32
32 33
33 34
34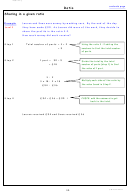 35
35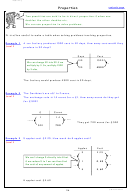 36
36 37
37 38
38 39
39 40
40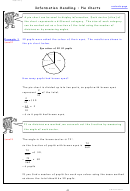 41
41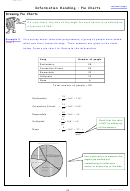 42
42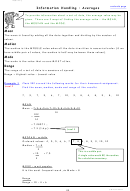 43
43 44
44 45
45 46
46 47
47FHS Numeracy
Information Handling : Pie Charts
contents page
A pie chart can be used to display information. Each sector (slice) of
the chart represents a different category. The size of each category
can be worked out as a fraction of the total using the number of
divisions or by measuring angles.
Example 1
30 pupils were asked the colour of their eyes. The results are shown in
Level 2
the pie chart below.
Eye colour of 30 S1 pupils
Hazel
Brown
Blue
Green
How many pupils had brown eyes?
The pie chart is divided up into ten parts, so pupils with brown eyes
2
represent
of the total.
10
2
of 30
10
= 30 x 2
10
= 6 so 6 pupils had brown eyes.
If no divisions are marked, we can work out the fraction by measuring
the angle of each sector.
The angle in the brown sector is 72.
Level 3
72
so the fraction of pupils with brown eyes is
360
72
of 30.
360
72
=
x 30
360
= 6 pupils
If you find a number of pupils for each eye colour using the same method
as above the total should be 30 pupils.
41
L Watson 2012
ADVERTISEMENT
0 votes
Related Articles
Related forms


Related Categories
Parent category: Education