Data Display Worksheet Page 2
ADVERTISEMENT
 1
1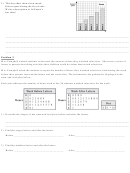 2
2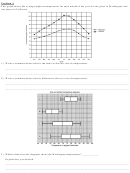 3
3 4
43) This bar chart shows how much
Ernest spent during the five weeks.
Write a description to fit Ernest’s
bar chart.
_______________________________________________________________________________________
_______________________________________________________________________________________
_______________________________________________________________________________________
_______________________________________________________________________________________
Problem 2
Mrs. Campbell wanted students to decrease the amount of time they watched television. She wrote a series of
letters to parents describing activities their children could do rather than watch television.
Mrs. Campbell asked the students to report the number of hours they watched television, both during the week
before their parents received the letters and the week after. The information she gathered is displayed in the
stem-and-leaf plots below.
Each plot indicates the number of hours each of her 26 students watched television for the week.
1) Describe the shapes of the stem-and-leaf plots before and after the letters.
_______________________________________________________________________________________
_______________________________________________________________________________________
2) Find the ranges before and after the letters.
Before ___________________________________
After ___________________________________
3) Find the medians before and after the letters.
Before ___________________________________
After ___________________________________
ADVERTISEMENT
0 votes
Related Articles
Related forms


Related Categories
Parent category: Business