Data Display Worksheet Page 3
ADVERTISEMENT
 1
1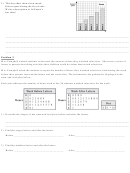 2
2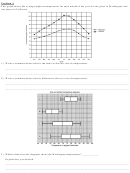 3
3 4
4Problem 3
This graph shows the average highest temperatures for each month of the year for one place in Washington and
one place in California.
1) Write a statement about what is the same in the two sets of temperatures.
_______________________________________________________________________________________
_______________________________________________________________________________________
2) Write a statement about what is different in the two sets of temperatures.
_______________________________________________________________________________________
_______________________________________________________________________________________
3) Which of the four box diagrams shows the Washington temperatures? ____________
Explain how you decided.
_______________________________________________________________________________________
_______________________________________________________________________________________
ADVERTISEMENT
0 votes
Related Articles
Related forms


Related Categories
Parent category: Business