Data Display Worksheet Page 4
ADVERTISEMENT
 1
1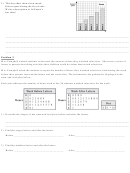 2
2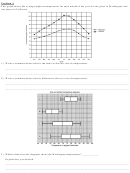 3
3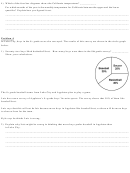 4
44) Which of the four box diagrams shows the California temperatures? ____________
For which months of the year is the monthly temperature for California between the upper and the lower
quartiles? Explain how you figured it out.
_______________________________________________________________________________________
_______________________________________________________________________________________
_______________________________________________________________________________________
_______________________________________________________________________________________
Problem 4
In Lake City, boys in the 8
grade were also surveyed. The results of this survey are shown in the circle graph
th
below.
1) Seventy-two boys liked basketball best. How many boys were there in the 8th grade survey? ____________
Show your calculations.
The 8
grade baseball teams from Lake City and Appleton plan to play a game.
th
Luis has seen a survey of Appleton’s 8
grade boys’ favorite sports. The survey shows that 50% of them like
th
baseball best.
Luis says that this will not be fair because more boys in Appleton like baseball best, so there will be more boys
to choose from for the team.
Kyle says he thinks Luis is wrong.
2) Explain why Luis might be wrong in thinking that more boys prefer baseball in Appleton than
in Lake City.
_______________________________________________________________________________________
_______________________________________________________________________________________
_______________________________________________________________________________________
_______________________________________________________________________________________
ADVERTISEMENT
0 votes
Related Articles
Related forms


Related Categories
Parent category: Business