Statistics Worksheet With Answer Key Page 13
ADVERTISEMENT
 1
1 2
2 3
3 4
4 5
5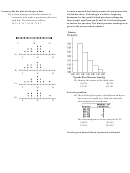 6
6 7
7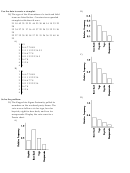 8
8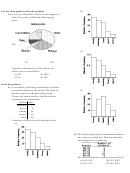 9
9 10
10 11
11 12
12 13
13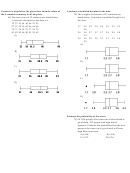 14
14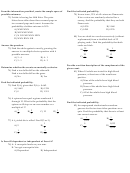 15
15 16
16 17
17 18
18 19
19 20
20Find the median for the given sample data.
Find the standard deviation for the given data. Round
63) The weights (in ounces) of 21 cookies are
your answer to one more decimal place than the original
shown. Find the median weight.
data.
0.67 1.42 0.83 1.62 0.75 0.82 1.03
67) Christine is currently taking college
1.42 1.53 0.93 0.67 1.21 1.04 0.83
astronomy. The instructor often gives quizzes.
0.47 1.21 0.82 1.04 1.72 0.75 0.56
On the past seven quizzes, Christine got the
A) 0.88 ounces
B) 1.42 ounces
following scores:
C) 0.93 ounces
D) 0.83 ounces
50 12 38 25 16 48 58
Compute the standard deviation s.
A) 17.9
B) 8715.6
Find the variance for the given data. Round your answer
C) 10,637
D) 38
to one more decimal place than the original data.
64) Compute the variance. A class of sixth grade
students kept accurate records on the amount
Find the range, variance, and standard deviation for each
of time they spent playing video games during
of the two samples, then compare the two sets of results.
a one-week period. The times (in hours) are
68) When investigating times required for
listed below:
drive-through service, the following results (in
19.8 21.6 13.4 26.7 25.6
seconds) were obtained.
19.2 17.0 12.9 26.8 15.2
A) 27.84
B) 27.94
Restaurant A 120 123 153 128 124 118 154 110
C) 152.13
D) 25.14
Restaurant B 115 126 147 156 118 110 145 137
A) Restaurant A: 46; 260.79; 16.15
Restaurant B: 44; 285.64; 16.90
Find the standard deviation of the data summarized in the
B) Restaurant A: 46; 260.79; 16.90
given frequency distribution.
Restaurant B: 44; 285.64; 16.15
65) The test scores of 40 students are summarized
C) Restaurant A: 44; 260.79; 16.15
in the frequency distribution below. Find the
Restaurant B: 46; 285.64; 16.90
standard deviation.
D) Restaurant A: 44; 285.64; 16.15
Restaurant B: 46; 260.79; 16.90
Score Students
50 - 59
8
60 - 69
6
70 - 79
10
80 - 89
5
90 - 99
11
A) s = 15.6
B) s = 14.2
C) s = 14.9
D) s = 13.4
Solve the problem.
66) The heights of the adults in one town have a
mean of 67.5 inches and a standard deviation
of 3.4 inches. What can you conclude from
Chebyshevʹs theorem about the percentage of
adults in the town whose heights are between
60.7 and 74.3 inches?
A) The percentage is at least 75%
B) The percentage is at least 95%
C) The percentage is at most 95%
D) The percentage is at most 75%
ADVERTISEMENT
0 votes
Related Articles
Related forms


Related Categories
Parent category: Education