Statistics Worksheet With Answer Key Page 9
ADVERTISEMENT
 1
1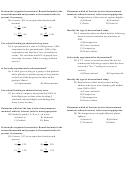 2
2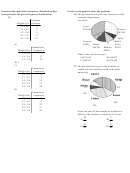 3
3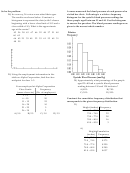 4
4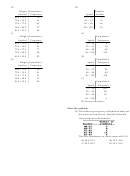 5
5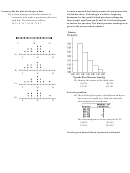 6
6 7
7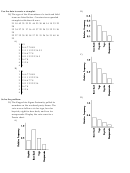 8
8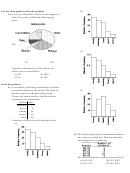 9
9 10
10 11
11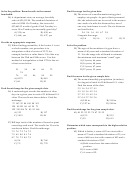 12
12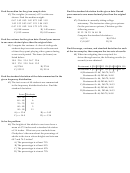 13
13 14
14 15
15 16
16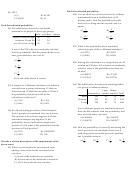 17
17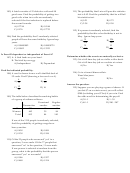 18
18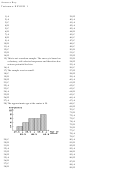 19
19 20
20Use the circle graph to solve the problem.
B)
40) A survey of the 4960 vehicles on the campus of
State University yielded the following pie
chart.
11%
14%
36%
9%
C)
2%
28%
Together, what percent of the vehicles are
either vans or convertibles?
A) 23%
B) 126%
C) 5%
D) 14%
Solve the problem.
41) A car dealer is deciding what kinds of vehicles
he should order from the factory. He looks at
D)
his sales report for the preceding period.
Choose the vertical scale so that the relative
frequencies are represented.
Vehicle Sales
Economy
32
Sports
8
Family
56
Luxury
16
Truck
48
Construct a Pareto chart to help him decide.
A)
42) The following frequency distribution analyzes
the scores on a math test. Find the indicated
class midpoint or boundaries.
The class boundaries of scores interval 95-99
A) 94.5, 99.5
B) 95.5, 100.5
C) 95.5, 99.5
D) 94.5, 100.5
ADVERTISEMENT
0 votes
Related Articles
Related forms


Related Categories
Parent category: Education