Statistics Worksheet With Answer Key Page 3
ADVERTISEMENT
 1
1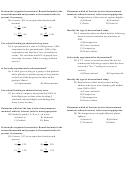 2
2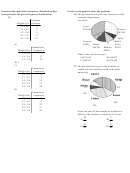 3
3 4
4 5
5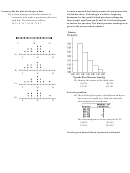 6
6 7
7 8
8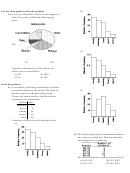 9
9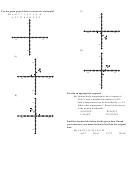 10
10 11
11 12
12 13
13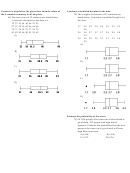 14
14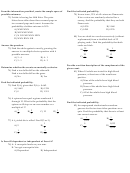 15
15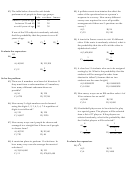 16
16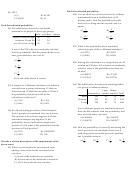 17
17 18
18 19
19 20
20Construct the cumulative frequency distribution that
Use the circle graph to solve the problem.
corresponds to the given frequency distribution.
26) The pie chart below gives the inventory of the
25)
womenʹs department
Number
of a store.
Weight (oz)
of Stones
1.2 - 1.6
5
Coats
1.7 - 2.1
2
$23,046
Dresses
2.2 - 2.6
5
$21,543
2.7 - 3.1
5
3.2 - 3.6
13
Skirts
Lingerie
$6012
A)
$3006
Slacks
Socks
Cumulative
$10,521
Blouses
$1503
Weight (oz)
Frequency
$4509
1.2 - 2.1
7
What is the total inventory?
2.2 - 3.1
17
A) $71,643
B) $68,637
3.2 - 3.6
30
C) $48,597
D) $70,140
B) 3
C)
27) The pie chart below gives the number of
Cumulative
students in the residence halls at the state
Weight (oz)
Frequency
university.
1.2 - 1.6
5
1.7 - 2.1
7
2.2 - 2.6
12
217
2.7 - 3.1
17
3.2 - 3.6
28
175
378
D)
Cumulative
154
Weight (oz)
Frequency
1.2 - 1.6
5
1.7 - 2.1
7
203
2.2 - 2.6
12
343
2.7 - 3.1
17
3.2 - 3.6
30
Write the ratio of the number of residents at
Fisher to the number of students at Carver.
49
7
A)
B)
31
30
49
31
C)
D)
30
49
ADVERTISEMENT
0 votes
Related Articles
Related forms


Related Categories
Parent category: Education