Statistics Worksheet With Answer Key Page 6
ADVERTISEMENT
 1
1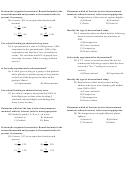 2
2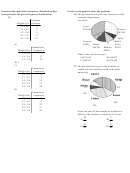 3
3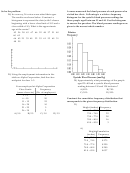 4
4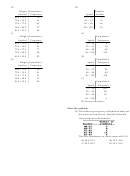 5
5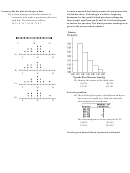 6
6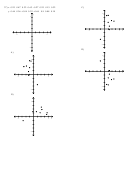 7
7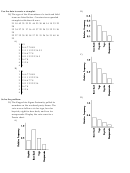 8
8 9
9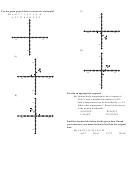 10
10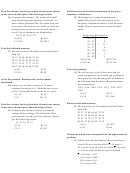 11
11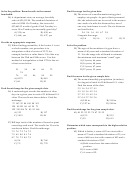 12
12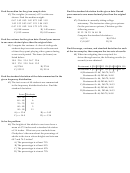 13
13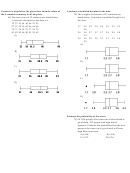 14
14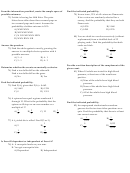 15
15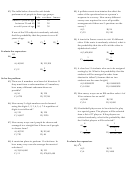 16
16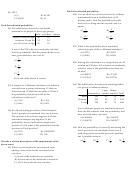 17
17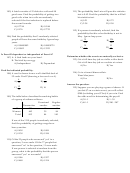 18
18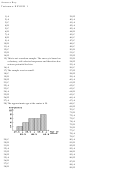 19
19 20
20Construct the dot plot for the given data.
A nurse measured the blood pressure of each person who
34) A store manager counts the number of
visited her clinic. Following is a relative-frequency
customers who make a purchase in his store
histogram for the systolic blood pressure readings for
each day. The data are as follows.
those people aged between 25 and 40. Use the histogram
10 11 8 14 7 10 10 11 8 7
to answer the question. The blood pressure readings were
given to the nearest whole number.
5
10
15
A)
5
10
15
B)
5
10
15
35) Identify the center of the third class.
A) 125
B) 124
C)
C) 120
D) 130
5
10
15
Solve the problem.
36) The following frequency distribution analyzes
D)
the scores on a math test. Find the indicated
5
10
15
class midpoint or boundaries.
The class midpoint of scores interval 40-59
A) 48.5
B) 49.5
C) 50.5
D) 49.0
Use the given paired data to construct a scatterplot.
ADVERTISEMENT
0 votes
Related Articles
Related forms


Related Categories
Parent category: Education