Statistics Worksheet With Answer Key Page 4
ADVERTISEMENT
 1
1 2
2 3
3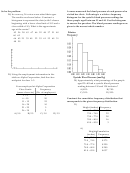 4
4 5
5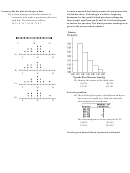 6
6 7
7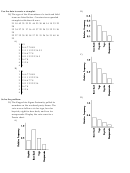 8
8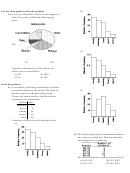 9
9 10
10 11
11 12
12 13
13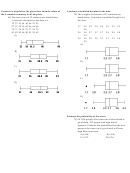 14
14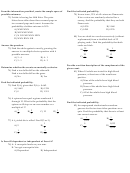 15
15 16
16 17
17 18
18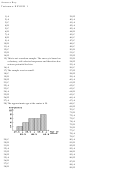 19
19 20
20Solve the problem.
A nurse measured the blood pressure of each person who
28) In a survey, 26 voters were asked their ages.
visited her clinic. Following is a relative-frequency
The results are shown below. Construct a
histogram for the systolic blood pressure readings for
histogram to represent the data (with 5 classes
those people aged between 25 and 40. Use the histogram
beginning with a lower class limit of 19.5 and a
to answer the question. The blood pressure readings were
class width of 10). What is the approximate
given to the nearest whole number.
age at the center?
43 56 28 63 67 66 52 48 37 51 40
60 62
66 45 21 35 49 32 53 61 53 69 31
48 59
29) Using the employment information in the
table on Alpha Corporation, find the class
midpoint for class 1-5.
30) Approximately what percentage of the people
aged 25-40 had a systolic blood pressure
Years employed at Alpha Corporation
reading between 110 and 139 inclusive?
Class Limits
Frequency
A) 89%
B) 74%
(years of service)
(No. of employees)
C) 39%
D) 59%
1 - 5
5
6 - 10
20
Construct the cumulative frequency distribution that
11 - 15
25
corresponds to the given frequency distribution.
16 - 20
10
31)
21 - 25
5
Height (inches) Frequency
26 - 30
3
69.0 - 71.9
19
A) 5.0
B) 2.5
C) 3.0
D) 3.5
72.0 - 74.9
22
75.0 - 77.9
20
78.0 - 80.9
16
81.0 - 83.9
3
A)
Height
Cumulative
(inches)
Frequency
69.0 - 71.9
0.237
72.0 - 74.9
0.275
75.0 - 77.9
0.250
78.0 - 80.9
0.200
81.0 - 83.9
0.037
ADVERTISEMENT
0 votes
Related Articles
Related forms


Related Categories
Parent category: Education