5.6 Analyzing Data Sets Examples And Worksheet - Chapter 5: Ratios, Rates, And Data Analysis Page 6
ADVERTISEMENT
 1
1 2
2 3
3 4
4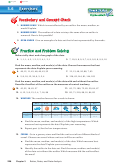 5
5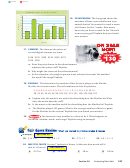 6
6English
Spanish
Volunteering at an Animal Shelter
18
16
15
16.
VOLUNTEERING
The bar graph shows the
14
numbers of hours you volunteered at an
12
11
animal shelter. You wanted to work a mean
10
10
9
of 10 hours for the 7 weeks. How many
8
7
6
hours do you have to work in the 7th week
6
to meet your goal? Explain how you found
4
2
your answer.
0
1
2
3
4
5
6
Week
17.
CAMERAS
The data are the prices of
several digital cameras at a store.
$130 $170 $230 $130 $250 $275
$130 $185
a. Does the price shown in the advertisement
represent the prices well? Explain.
b. Why might the store use this advertisement?
c. In this situation, why might a person want to know the mean? the median?
the mode? the range? Explain.
18.
BASEBALL
The data show the number of hits for each player on the Florida
Marlins in a recent season. The red numbers are hits for pitchers.
0, 0, 0, 0, 0, 0, 0, 0, 0, 0, 0, 0, 1, 1, 1, 1, 2, 2, 3, 3, 5, 9, 9, 15, 18,
28, 33, 35, 45, 46, 54, 58, 105, 107, 113, 127, 138, 155, 188, 212
a. Explain why the mode is not useful for describing how the Marlins hit. What
does the mode describe well?
b. Is the mean or the median useful for describing how the Marlins hit? Explain.
c. The Marlins played 162 games. What is the average number of hits in a game
for the Marlins for the season? Explain how you found your answer.
19.
You increase every number in a data set by 2. What happens to
the mean, median, mode, and range? Explain using an example.
Multiply.
SECTION 3.2
20. 3.14 × 8
21. 2.6 × 2
22. 2.71 × 7
23. 4.6 × 3 × 4
24.
MULTIPLE CHOICE
It rains 7 inches in 4 hours. At this rate how much will it
rain in 15 hours?
SECTION 5.3
○
8.57 in.
○
26.25 in.
○
28 in.
○
105 in.
A
B
C
D
Section 5.6
Analyzing Data Sets
227
ADVERTISEMENT
0 votes
Related Articles
Related forms


Related Categories
Parent category: Education