5.6 Analyzing Data Sets Examples And Worksheet - Chapter 5: Ratios, Rates, And Data Analysis Page 5
ADVERTISEMENT
 1
1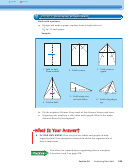 2
2 3
3 4
4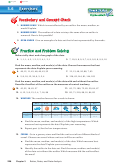 5
5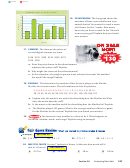 6
6English
Spanish
Exercises
5.6
Help with Homework
1.
NUMBER SENSE
Which is most affected by an outlier: the mean, median, or
mode? Explain.
2.
NUMBER SENSE
The median of a data set stays the same after an outlier is
removed. How is this possible?
3.
OPEN-ENDED
Give an example of a data set that is best represented by the mode.
Make a tally chart and a bar graph of the data.
4. 1, 1, 1, 4, 3, 1, 2, 2, 2, 4, 1, 2, 1
5. 7, 10, 9, 8, 9, 9, 7, 6, 9, 9, 8, 8, 9, 9, 10
Find the mean, median, and mode(s) of the data. Choose the measure that best
represents the data. Explain your reasoning.
1
1
6. 48, 12, 11, 45, 48, 48, 43, 32
7. 12, 13, 40, 95, 88, 7, 95
8. 2, 8, 10, 12, 56, 9, 5, 2, 4
9. 126, 62, 144, 81, 144, 103
Find the mean, median, and mode(s) of the data with and without the outlier.
Describe the effect of the outlier on the measures of central tendency.
2 2
10. 45, 52, 18, 63, 57
11. 65, 72, 180, 72, 85, 59, 64, 67
12. 6, 12, 5, 8, 15, 5, 4, 7, 16, 80
13. 85, 71, 210, 88, 91, 84, 85
14.
WEATHER
The weather forecast for a week is shown.
Mon
Thu
Sun
Tue
Wed
Fri
Sat
High
91º F
89º F
97º F
99º F
91º F
90º F
101º F
Low
78º F
83º F
78º F
74º F
77º F
77º F
72º F
a. Find the mean, median, and mode(s) of the high temperatures. Which
measure best represents the data? Explain your reasoning.
b. Repeat part (a) for the low temperatures.
15.
CEREAL
Go to a grocery store and fi nd the unit cost of ten different kinds of
cereal. Choose one cereal whose unit cost will be an outlier.
a. Find the mean, median, and mode(s) of the data. Which measure best
represents the data? Explain your reasoning.
b. Identify the outlier in the data set. Find the mean, median, and mode(s)
of the data set without the outlier. Which measure did the outlier affect
the most?
226
Chapter 5
Ratios, Rates, and Data Analysis
ADVERTISEMENT
0 votes
Related Articles
Related forms


Related Categories
Parent category: Education