5.6 Analyzing Data Sets Examples And Worksheet - Chapter 5: Ratios, Rates, And Data Analysis Page 4
ADVERTISEMENT
 1
1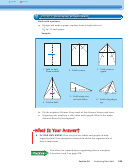 2
2 3
3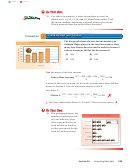 4
4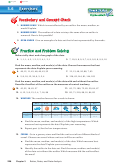 5
5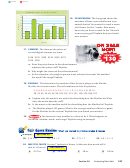 6
6English
Spanish
3. The times (in minutes) it takes six students to travel to
school are 8, 10, 10, 15, 20, and 45. Identify the outlier. Find
Exercises 10–13
the mean, median, and mode with and without the outlier.
Which measure does the outlier affect the most?
3 3
Standardized Test Practice
EXAMPLE
The bar graph shows the free throws made by an
Free Throws Made
Orlando Magic player in the last four seasons. How
600
many free throws does he need to make in Season 5
500
529
to have a mean of 400 for the fi ve seasons?
400
390
356
300
388
396
○
○
A
B
277
200
○
428
○
448
C
D
100
0
1
2
3
4
5
Season
Find the mean of the four seasons.
277 + 356 + 390 + 529
1552
=
——
—
Mean of four seasons:
, or 388
4
4
A mean of 400 is an increase. So, he needs to make more than 400 free
throws in Season 5. You can eliminate choices A and B.
Try choice C.
✗
277 + 356 + 390 + 529 +
428
1980
=
———
—
Choice C:
, or 396
5
5
You have eliminated choices A, B, and C. The correct answer is
○
.
D
4. The pictograph shows the
Number of Miles Biked
number of miles you ride
on your bike for 6 days.
Monday
= 2 miles
How many miles do you
need to bike on Sunday
Tuesday
so that your mean for the
Wednesday
week is 5 miles per day?
Thursday
Friday
Saturday
Section 5.6
Analyzing Data Sets
225
ADVERTISEMENT
0 votes
Related Articles
Related forms


Related Categories
Parent category: Education