Easter Bar Graph Worksheets With Answer Keys Page 10
ADVERTISEMENT
 1
1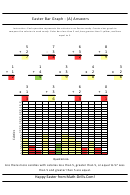 2
2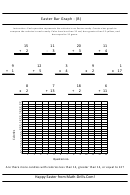 3
3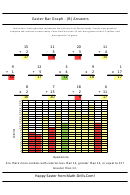 4
4 5
5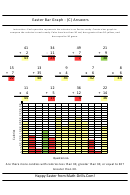 6
6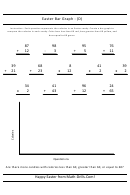 7
7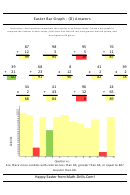 8
8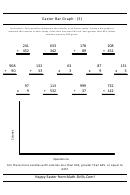 9
9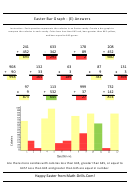 10
10Easter Bar Graph - (E) Answers
Instruction : Each question represents the calories in an Easter candy. Create a bar graph to
compare the calories in each candy. Color bars less than 645 red, bars greater than 645 yellow,
and bars equal to 645 green.
241
633
178
208
+ 452
-
342
÷
89
+ 452
693
291
2
660
908
132
63
87
131
+
90
+
33
x
3
x
9
x
3
998
165
189
783
393
97
113
999
732
x
9
+
532
÷
37
+ 142
873
645
27
874
Are there more candies with calories less than 645, greater than 645, or equal to
645? Less than 645 and greater than 645 are equal in number.
Happy Easter from Math-Drills.Com!
ADVERTISEMENT
0 votes
Related Articles
Related forms

 Worksheet With Answer Key")
 Worksheet With Answer Key")
 Worksheet With Answer Key")
 Worksheet With Answer Key")


Related Categories
Parent category: Education