Easter Bar Graph Worksheets With Answer Keys Page 4
ADVERTISEMENT
 1
1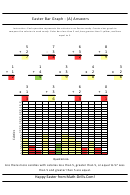 2
2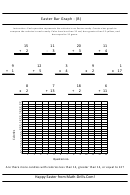 3
3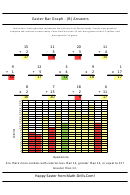 4
4 5
5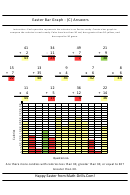 6
6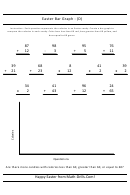 7
7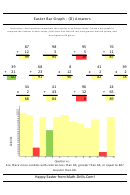 8
8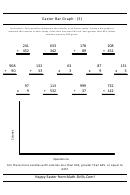 9
9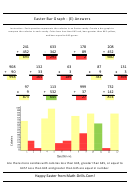 10
10Easter Bar Graph - (B) Answers
Instruction : Each question represents the calories in an Easter candy. Create a bar graph to
compare the calories in each candy. Color bars less than 12 red, bars greater than 12 yellow, and
bars equal to 12 green.
15
11
20
11
+
2
-
3
÷
3
+
4
17
8
7
15
9
12
3
9
1
+ 1
+
5
x
4
x
2
x 17
10
17
12
18
17
8
7
18
6
x
2
+ 13
÷
2
+ 11
16
20
9
17
22
21
20
19
18
17
16
15
14
13
12
11
10
9
8
7
6
5
4
3
2
1
0
1
2
3
4
5
6
7
8
9
10
11
12
13
Question no.
Are there more candies with calories less than 12, greater than 12, or equal to 12?
Greater than 12.
Happy Easter from Math-Drills.Com!
ADVERTISEMENT
0 votes
Related Articles
Related forms

 Worksheet With Answer Key")
 Worksheet With Answer Key")
 Worksheet With Answer Key")
 Worksheet With Answer Key")


Related Categories
Parent category: Education