3.1 Quadratic Functions Examples And Worksheet - Chapter 3: Polynomial And Rational Functions Page 9
ADVERTISEMENT
 1
1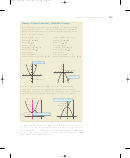 2
2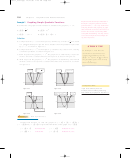 3
3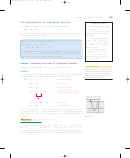 4
4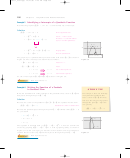 5
5 6
6 7
7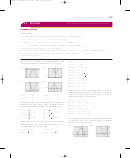 8
8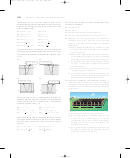 9
9 10
10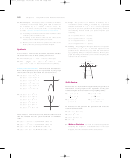 11
11333371_0301.qxp
12/27/06
1:20 PM
Page 260
260
Chapter 3
Polynomial and Rational Functions
In Exercises 29 – 34, write the standard form of the
In Exercises 49 – 52, find two positive real numbers whose
quadratic function that has the indicated vertex and whose
product is a maximum.
graph passes through the given point. Verify your result
49. The sum is 110.
with a graphing utility.
50. The sum is S.
29. Vertex:
2, 5 ;
Point:
0, 9
51. The sum of the first and twice the second is 24.
30. Vertex:
4, 1 ;
Point:
6,
7
52. The sum of the first and three times the second is 42.
31. Vertex:
1,
2 ;
Point:
1, 14
53. Geometry An indoor physical fitness room consists of a
32. Vertex:
4,
1 ;
Point:
2, 4
rectangular region with a semicircle on each end. The
1
21
33. Vertex:
, 1 ;
Point:
2,
perimeter of the room is to be a 200-meter single-lane
2
5
1
17
running track.
34. Vertex:
,
1 ;
Point:
0,
4
16
(a) Draw a diagram that illustrates the problem. Let and
x
Graphical Reasoning In Exercises 35– 38, determine the
y
represent the length and width of the rectangular
x-intercept(s) of the graph visually. How do the x-intercepts
region, respectively.
correspond to the solutions of the quadratic equation when
(b) Determine the radius of the semicircular ends of the
y
0?
track. Determine the distance, in terms of
y,
around the
inside edge of the two semicircular parts of the track.
35.
36.
(c) Use the result of part (b) to write an equation, in terms
y = x
− 4x − 5
2
y = 2x
+ 5x − 3
2
4
1
of
x
and
y,
for the distance traveled in one lap around
−7
5
the track. Solve for
y.
−9
12
(d) Use the result of part (c) to write the area
A
of the
rectangular region as a function of
x.
(e) Use a graphing utility to graph the area function from
−10
−7
part (d). Use the graph to approximate the dimensions
that will produce a rectangle of maximum area.
37.
38.
54. Numerical, Graphical, and Analytical Analysis
A
y = x
+ 8x + 16
2
y = x
− 6x + 9
2
7
rancher has 200 feet of fencing to enclose two adjacent
10
rectangular corrals (see figure). Use the following methods
to determine the dimensions that will produce a maximum
enclosed area.
−10
−8
2
10
−1
−2
In Exercises 39–44, use a graphing utility to graph the
quadratic function. Find the -intercepts of the graph and
x
compare them with the solutions of the corresponding
y
quadratic equation when
y
0.
x
x
2
2
39.
y
x
4x
40.
y
2x
10x
2
2
41.
y
2x
7x
30
42.
y
4x
25x
21
1
7
2
2
43.
y
x
6x
7
44.
y
x
12x
45
(a) Write the area
A
of the corral as a function of
x.
2
10
(b) Use the table feature of a graphing utility to create
In Exercises 45– 48, find two quadratic functions, one that
a table showing possible values of
x
and the
opens upward and one that opens downward, whose graphs
corresponding areas
A
of the corral. Use the table to
have the given x-intercepts. (There are many correct
estimate the dimensions that will produce the
answers.)
maximum enclosed area.
45.
1, 0 , 3, 0
46.
0, 0 , 10, 0
(c) Use a graphing utility to graph the area function. Use
1
5
47.
3, 0 ,
, 0
48.
, 0 , 2, 0
the graph to approximate the dimensions that will
2
2
produce the maximum enclosed area.
ADVERTISEMENT
0 votes
Related Articles
Related forms


Related Categories
Parent category: Education