Graphing And Analyzing Data Worksheet With Answers Page 10
ADVERTISEMENT
 1
1 2
2 3
3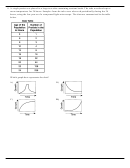 4
4 5
5 6
6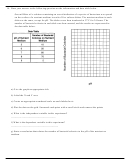 7
7 8
8 9
9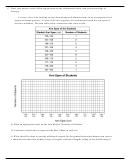 10
10 11
11 12
1217. Base your answer to the following question on the information below and your knowledge of
biology.
A science class was studying various human physical characteristics in an investigation for a
report on human genetics. As part of the investigation, the students measured the arm span of
the class members. The data table below summarizes the class results.
a) Mark an appropriate scale on the axis labeled "Number of Students."
b) Construct vertical bars to represent the data. Shade in each bar.
c) What should be done to provide additional support for the generalization that human arm span is
a characteristic that falls within a range of lengths, with most lengths falling in the middle ranges?
ADVERTISEMENT
0 votes
Related Articles
Related forms


Related Categories
Parent category: Education