Graphing And Analyzing Data Worksheet With Answers Page 6
ADVERTISEMENT
 1
1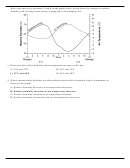 2
2 3
3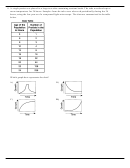 4
4 5
5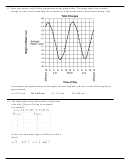 6
6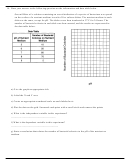 7
7 8
8 9
9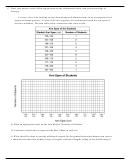 10
10 11
11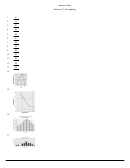 12
1212. Base your answer to the following question on the graph below. The graph shows the recorded
change in water level (ocean tides) at a coastal city in the northeastern United States during 1 day.
According to the pattern shown on the graph, the next high tide will occur on the following day at
approximately
A) 12:30 a.m.
B) 2:00 a.m.
C) 3:15 a.m.
D) 4:00 a.m.
13. The table below shows the number of algae that
exist after hours of living in an aquatic
environment.
At this rate, how many algae will there be after 6
hours?
A)
B)
C)
D)
ADVERTISEMENT
0 votes
Related Articles
Related forms


Related Categories
Parent category: Education