Graphing And Analyzing Data Worksheet With Answers Page 5
ADVERTISEMENT
 1
1 2
2 3
3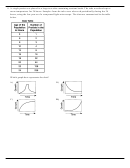 4
4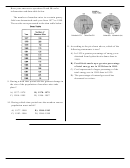 5
5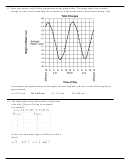 6
6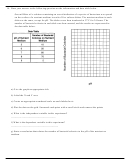 7
7 8
8 9
9 10
10 11
11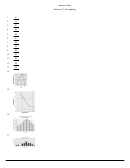 12
12Base your answers to questions 9 and 10 on he
information and data table below.
The number of meadow mice in a certain grassy
field was determined each year from 1977 to 1989.
The results are represented in the data table below.
11. According to the pie charts above, which of the
following statements is true?
A) In 1939 a greater percentage of energy was
obtained from hydroelectric dams than in
1989.
B) Fossil fuels made up a greater percentage
of total energy use in 1939 than in 1989.
C) Coal represented a larger percentage of the
total energy use in 1989 than in 1939.
D) The percentage of natural gas used has
decreased over time.
9. During which time period did the greatest change in
the size of the population of meadow mice take
place?
A) 1977–1978
B) 1978–1979
C) 1984–1985
D) 1986–1987
10. During which time period was the meadow mouse
population most stable?
A) 1977–1980
B) 1980–1983
C) 1983–1986
D) 1986–1989
ADVERTISEMENT
0 votes
Related Articles
Related forms


Related Categories
Parent category: Education