Graphing And Analyzing Data Worksheet With Answers Page 2
ADVERTISEMENT
 1
1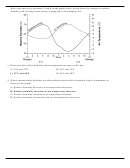 2
2 3
3 4
4 5
5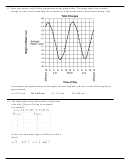 6
6 7
7 8
8 9
9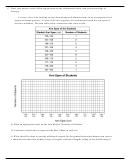 10
10 11
11 12
12Base your answers to questions 3 and 4 on the graph below, which shows the changes in relative
humidity and air temperature during a spring day in Washington, D.C.
3. What were the relative humidity and air temperature at noon on this day?
A) 47% and 32°F
B) 65% and 32°F
C) 47% and 48°F
D) 65% and 48°F
4. Which statement best describes the relationship between relative humidity and air temperature as
shown by the graph?
A) Relative humidity decreases as air temperature decreases.
B) Relative humidity decreases as air temperature increases.
C) Relative humidity increases as air temperature increases.
D) Relative humidity remains the same as air temperature decreases.
ADVERTISEMENT
0 votes
Related Articles
Related forms


Related Categories
Parent category: Education