Chapter 9 Statistics Worksheet With Answers Page 16
ADVERTISEMENT
 1
1 2
2 3
3 4
4 5
5 6
6 7
7 8
8 9
9 10
10 11
11 12
12 13
13 14
14 15
15 16
16 17
17 18
18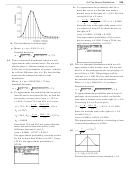 19
19 20
20 21
21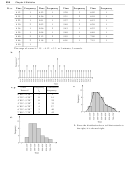 22
22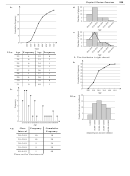 23
23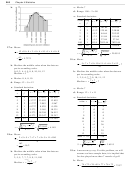 24
24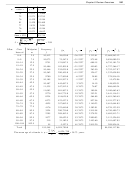 25
25 26
26 27
27 28
28 29
29 30
30232
Chapter 9 Statistics
B: A score is between μ + 0.6 σ and μ + 1.6 σ . We
( continued )
know that the area under the curve from 0 to
Z = 1.6 is 0.4452. We find the area under the
curve from 0 to Z = 0.6 is 0.2257. The area
under the curve between the two Z -scores is the
difference between the two areas,
0.4452 – 0.2257, which is 0.2195. So, 21.95% of
the class will get a grade of B.
23. To approximate the probability of obtaining 300
C: A score is between μ – 0.3 σ and μ + 0.6 σ . We
or more successes in the 750 trials, we find the
use symmetry and find the area under the curve
area under a normal curve to the right of
between 0 and Z = −0.3 is 0.1179. We found in
x = 299.5.
μ
part (b) that the area under the curve from 0 to
−
−
x
299.5 300
=
=
= −
≈ −
⇒
Z
0.0373
0.04
Z = 0.6 is 0.2257. Here since the Z -scores have
σ
13.4
opposite signs we add the two areas,
A = 0.0160
0.1179 + 0.2257, and get 0.3436. So, 34.36% of
So, the approximate probability of obtaining 300
the class will get a grade of C.
or more successes is approximately
D: A score is between μ – 1.4 σ and μ − 0.3 σ . We
0.5 + 0.0160 = 0.5160
use symmetry and find the areas under the curve
25. To approximate the probability of obtaining 325
between 0 and Z = −1.4, which is 0.4192, and 0
or more successes in the 750 trials, we find the
and Z = −0.3, which is 0.1179. Since both Z -
area under a normal curve to the right of
scores are negative, the area between them is the
x = 324.5. We first convert 324.5 to a Z -score.
difference between 0.4192 and 0.1179, which is
μ
−
−
0.3013. So, 30.13% of the class will get a grade
x
324.5 300
=
=
=
⇒
Z
1.8284
σ
of D.
13.4
F: A score is below μ – 1.4 σ . Use the symmetry
A = 0.4664
of the curve to determine that the area between 0
We need the area to the right of Z = 1.83, so
and Z = −1.4 is 0.4192. But we need the area to
subtract A from 0.5000.
the left of Z , so we subtract 0.4192 from 0.5, the
Area = 0.5000 – 0.4664 = 0.0336
total area under the curve to the left of 0.
The approximate probability of 325 or more
0.5000− 0.4192 = 0.0808
successes is 0.0336. Using a TI-84, the
So, 8.08% of the class will get a grade of F.
approximate probability is 0.0343.
(Note: When you add all the percents you
should get 100%, the entire class.)
29. We are told that x = 64 and S = 2. We will
convert the given heights to Z -scores to
determine the percent of women in the required
intervals. Then we will calculate how many of
27. We use the Standard Normal Curve Table and
the 2000 women are in the interval.
the interpretation of a Z -score as the number of
a. Between 62 and 66 inches tall
standard deviations the original score is from its
These women are within 1 standard deviation
mean to solve this problem.
of the mean, 64 – 2 = 62 and 64 + 2 = 66. This
A: A score exceeds μ + 1.6 σ . Here Z = 1.6; the
gives Z
= −1.0 which corresponds to
1
area under the standard normal curve between 0
A
= 0.3413, and Z
= 1 which corresponds to
1
2
and 1.6 is 0.4452. We need the area to the right
A
= 0.3413. Since the two Z -scores are on
2
of Z = 1.6. So we subtract 0.4452 from 0.5, the
opposite sides of the mean, add the
area under the curve to the right of 0.
corresponding areas.
0.5000 – 0.4452 = 0.0548
Area = A
+ A
= 0.3413 + 0.3413 = 0.6826
1
2
So, 5.48% of the class will get a grade of A.
So, approximately 68.26% of the women or
1365 of the 2000 women sampled will be
between 62 and 66 inches tall.
ADVERTISEMENT
0 votes
Related Articles
Related forms


Related Categories
Parent category: Education