Chapter 9 Statistics Worksheet With Answers Page 18
ADVERTISEMENT
 1
1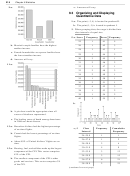 2
2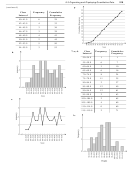 3
3 4
4 5
5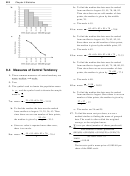 6
6 7
7 8
8 9
9 10
10 11
11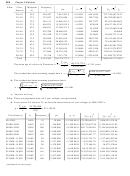 12
12 13
13 14
14 15
15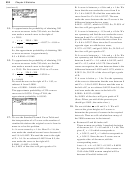 16
16 17
17 18
18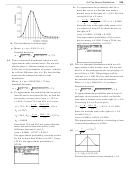 19
19 20
20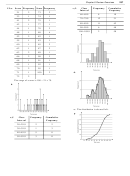 21
21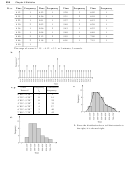 22
22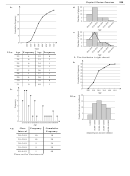 23
23 24
24 25
25 26
26 27
27 28
28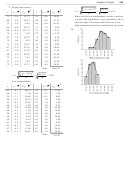 29
29 30
30234
Chapter 9 Statistics
(continued)
Mary’s score was 89; Mary’s standard score is
μ
−
−
x
89 93
=
=
= −
We will use an approximate
Z
2.0
σ
μ
=
2
Z = 0.525. Using Z = 0.525,
and
10, 000
Kathleen’s score was 21; Kathleen’s standard
σ
=
1000,
solve
μ
−
−
x
21 24
μ
−
=
=
= −
x
score is
Z
0.33
=
σ
Z
9
σ
Kathleen has the highest relative standing.
−
x
10000
=
0.525
38. We are told that the mean grade is 75.0 and the
1000
standard deviation is 10.0. To determine how
= −
⇒ =
many students are in the class, convert 68.0 and
525
x
10000
x
10, 525
82.0 to Z-scores and find the percent of area
Attendance lower than 10,525 will be in the
between them.
lowest 70% of the figures.
μ
−
−
x
68.0 75.0
=
=
=
= −
⇒
1
x
68 :
Z
0.70
b. To find the percent of attendance figures that
1
1
σ
10.0
falls between 8500 and 11,000 persons, find
=
A
0.2580
1
the Z-score for each and determine the area
μ
−
−
x
82.0 75.0
=
=
=
=
⇒
2
under the standard normal curve between the
x
82 :
Z
0.70
2
2
σ
10.0
two Z-scores.
=
A
0.2580
μ
−
−
2
x
8500 10000
=
=
= −
⇒
1
Z
1.5
Since the Z-scores are on opposite sides of the
1
σ
1000
=
mean, the area is the sum of A
and A
.
A
0.4332
1
2
1
Area = 0.2580 + 0.2580 = 0.5160
μ
−
−
x
11000 10000
=
=
=
⇒
2
Z
1.0
Approximately 51.6% of the class scored
2
σ
1000
between 68 and 82 on the final exam. This
=
A
0.3413
2
corresponds to the 15 students who got Cs. If we
Since the Z-scores are on opposite sides of the
let x represent the number of students in
mean, add the areas.
Mathematics 135, then we solve the equation
Area = 0.4332 + 0.3413 = 0.7745
0.516x = 15. We find x = 29.07. There are 29
Approximately 77.45% of the attendance
students in Mathematics 135.
figures are between 8500 and 11,000 persons.
39. a. To find the line chart and the frequency curve,
c. Here we are looking for the percent of
we need to first find the frequency distribution
attendance figures that are more than 11,500
for the experiment. It is binomial with n = 15
or less than 8500. First find the Z-scores and
and p = 0.3. The distribution follows.
areas corresponding to x = 11,500 and
Number of
Probability
x = 8500.
Heads,
k
b
(15,
k
, 0.3)
μ
−
−
x
11500 10000
=
=
=
⇒
1
Z
1.5
0
.005
1
σ
1000
1
.031
=
A
0.4332
1
2
.092
From part (b), Z
= −1.5 and A
= 0.4332.
2
2
3
.170
Now find the area under the standard normal
4
.219
curve outside the two Z-scores. Since the Z-
5
.206
scores are on opposite sides of the mean, add
6
.147
these areas.
7
.081
Area = (0.5000 − 0.4332) + (0.5000 − 0.4332)
8
.035
= 0.1336
9
.012
Approximately 13.36% of the attendance
10
.003
figures differ from the mean by 1500 persons
11
.0006
or more.
12
.0001
37. Transform each score to a standard score and
<
13
0.0001
then compare.
<
14
0.0001
Colleen’s score was 76; Colleen’s standard
<
15
0.0001
μ
−
−
x
76 82
=
=
= −
score is
Z
0.857
σ
7
ADVERTISEMENT
0 votes
Related Articles
Related forms


Related Categories
Parent category: Education