Chapter 9 Statistics Worksheet With Answers Page 2
ADVERTISEMENT
 1
1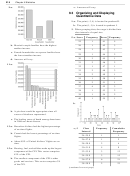 2
2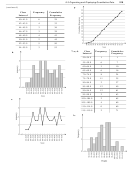 3
3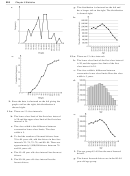 4
4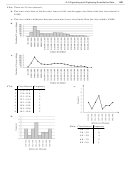 5
5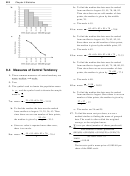 6
6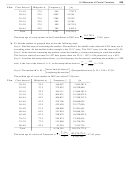 7
7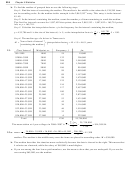 8
8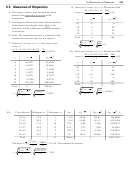 9
9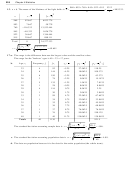 10
10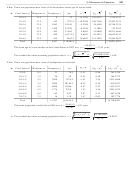 11
11 12
12 13
13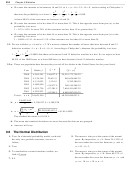 14
14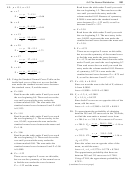 15
15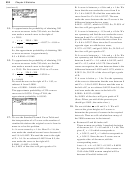 16
16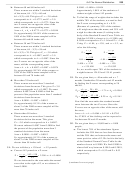 17
17 18
18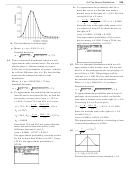 19
19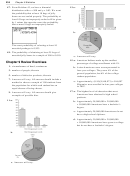 20
20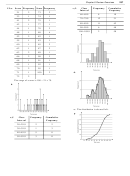 21
21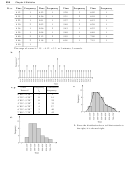 22
22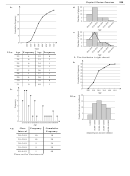 23
23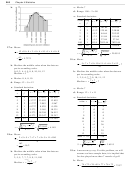 24
24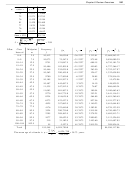 25
25 26
26 27
27 28
28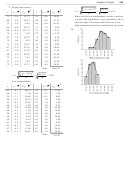 29
29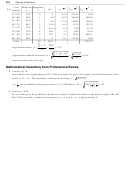 30
30218
Chapter 9 Statistics
c. Answers will vary.
9. a.
9.3 Organizing and Displaying
Quantitative Data
1. a. The point (−3, 4) is located in quadrant II.
b. The point (1, 5) is located in quadrant I.
3. When grouping data, the range is divided into
class intervals of equal size.
5. a. Score
Frequency
Score Frequency
25
1
41
5
b. Married−couple families have the highest
26
1
42
3
median income.
28
1
43
1
c. Female householder−no spouse families have
29
1
44
2
the lowest median income.
30
3
45
1
d. Answers will vary.
31
2
46
2
11. a.
32
1
47
1
33
2
48
3
34
2
49
1
35
1
50
1
36
2
51
1
37
4
52
3
38
1
53
2
39
1
54
2
40
1
55
1
b.
b. A pie chart would be appropriate since all
causes of death are represented.
c. The leading cause of death among Americans
in 2006 was heart disease.
13. a. Hawaiian Airlines had the highest percentage
c., f.
Class
Frequency
Cumulative
of on-time flights.
Interval
Frequency
b. Comair had the lowest percentage of on-time
24−25.9
1
1
flights.
26−27.9
1
2
c. About 85% of United Airlines’ flights are on
28−29.9
2
4
time.
30−31.9
5
9
15. a. Housing, fuel, and utilities make up the largest
component of the CPI. This sector comprises
32−33.9
3
12
42% of the CPI.
34−35.9
3
15
b. The smallest component of the CPI is other
36−37.9
6
21
goods and services. This sector comprises 3%
38−39.9
2
23
of the CPI.
(continued on next page)
ADVERTISEMENT
0 votes
Related Articles
Related forms


Related Categories
Parent category: Education