Chapter 9 Statistics Worksheet With Answers Page 15
ADVERTISEMENT
 1
1 2
2 3
3 4
4 5
5 6
6 7
7 8
8 9
9 10
10 11
11 12
12 13
13 14
14 15
15 16
16 17
17 18
18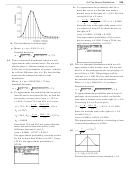 19
19 20
20 21
21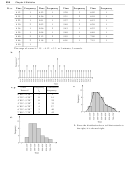 22
22 23
23 24
24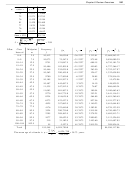 25
25 26
26 27
27 28
28 29
29 30
309.6 The Normal Distribution
231
μ
σ
=
=
Read down the table under Z until you reach
13.
13.1,
9.3
the row beginning 1.2. Then read across the
a. x = 7
row until you reach the entry under the
μ
−
−
x
7 13.1
=
=
= −
column marked 0.02. Because of symmetry,
Z
0.66
σ
9.3
0.3888 is area under the standard normal
curve between Z = −1.22 and 0, as well as
b. x = 9
between 0 and Z = 1.22.
μ
−
−
x
9 13.1
=
=
= −
Z
0.44
σ
e. Z = 2.30
9.3
Read down the table under Z until you reach
c. x = 13
the row beginning 2.3. The next entry in the
μ
−
−
x
13 13.1
row, 0.4893, represents the area under the
=
=
= −
Z
0.01
σ
9.3
standard normal curve between the mean and
Z = 2.30.
d. x = 29
μ
−
−
f. Z = −0.75
x
29 13.1
=
=
=
Z
1.71
σ
There are no negative Z- scores on this table,
9.3
but we use the symmetry of the normal curve
e. x = 37
to find the area under the curve between
μ
−
−
x
37 13.1
Z = −0.75 and the mean. Read down the table
=
=
=
Z
2.57
σ
under Z until you reach the row beginning 0.7.
9.3
Then read across the row until you reach the
f. x = 41
entry under the column marked 0.05. Because
μ
−
−
x
41 13.1
of symmetry, 0.2734 is area under the
=
=
=
Z
3
σ
standard normal curve between Z = −0.75 and
9.3
0, as well as between 0 and Z = 0.75.
15. Using the Standard Normal Curve Table on the
17. Z = −0.5, A = 0.1915
inside back cover of the text, we can find the
Since we want the area to the left of Z , subtract
area under the standard normal curve between
A from 0.5000.
the standard score, Z , and the mean.
Area = 0.5000 − 0.1915 = 0.3085
a. Z = 0.89
Read down the table under Z until you reach
19. Z
= −1.2, A
= 0.3849
1
1
the row beginning 0.8. Then read across the
Z
= 1.5, A
= 0.4332
2
2
row until you reach the entry under the
Since both Z -scores are on opposite sides of the
column marked 0.09. The area under the
mean, add the areas.
standard normal curve between 0 and Z =0.89
Area = A
+ A
= 0.3849 + 0.4332 = 0.8181
1
2
is 0.3133.
21. To approximate the probability of obtaining
b. Z = 1.10
between 285 and 315 successes in the 750 trials,
Read down the table under Z until you reach
we find the area under a normal curve from
the row beginning 1.1. The next entry in the
x = 284.5 to x = 315.5. We convert to Z -scores.
row, 0.3642, represents the area under the
μ
−
−
x
284.5 300
=
=
= −
⇒
standard normal curve between the mean and
x = 284.5:
Z
1.16
1
σ
13.4
Z =1.10.
A =
0.3770
1
c. Z = 3.06
μ
−
−
x
315.5 300
=
=
=
⇒
Read down the table under Z until you reach
x = 315.5:
Z
1.16
2
σ
13.4
the row beginning 3.0. Then read across the
A =
0.3770
row until you reach the entry under the
2
column marked 0.06. The area under the
Since the values are on opposite sides of the
standard normal curve between 0 and Z =3.06
mean, we add the areas.
is 0.4989.
Area = A
+ A
= 0.3770 + 0.3770 = 0.7540
1
2
The approximate probability that there are
d. Z = −1.22
between 285 and 315 successes is 0.7540.
There are no negative Z- scores on this table,
Using a TI-84, the approximate probability is
but we use the symmetry of the normal curve
0.7521.
to find the area under the curve between
( continued on next page )
Z = −1.22 and the mean.
ADVERTISEMENT
0 votes
Related Articles
Related forms


Related Categories
Parent category: Education