Probability Distributions Worksheets Page 2
ADVERTISEMENT
 1
1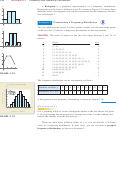 2
2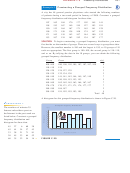 3
3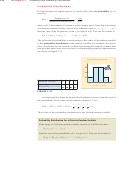 4
4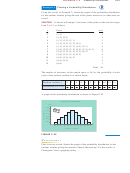 5
5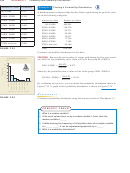 6
6 7
7 8
8A36
A P P E N D I X C
Probability and Probability Distributions
A histogram is a graphical representation of a frequency distribution.
n(x)
Histograms can be done in different ways. For instance, Figure C.18 shows three
3
different styles of histograms that can be constructed for the frequency distribu-
tion in Example 1.
2
1
Example 2
Constructing a Frequency Distribution
x
0
1
2
3
Two six-sided dice are tossed. Let the random variable be the sum of the points
x
n(x)
on the two dice. Construct a frequency distribution for this experiment.
3
The sums of points on the two dice range between 2 and 12, as
SOLUTION
2
follows.
1
x
Event
n x
x
2
1, 1
1
0
1
2
3
3
1, 2 , 2, 1
2
n(x)
4
1, 3 , 2, 2 , 3, 1
3
5
1, 4 , 2, 3 , 3, 2 , 4, 1
4
3
6
1, 5 , 2, 4 , 3, 3 , 4, 2 , 5, 1
5
2
7
1, 6 , 2, 5 , 3, 4 , 4, 3 , 5, 2 , 6, 1
6
1
8
2, 6 , 3, 5 , 4, 4 , 5, 3 , 6, 2
5
9
3, 6 , 4, 5 , 5, 4 , 6, 3
4
x
10
4, 6 , 5, 5 , 6, 4
3
1
2
3
11
5, 6 , 6, 5
2
F I G U R E C . 1 8
12
6, 6
1
The frequency distribution can be constructed as follows.
Frequency Distribution
n(x)
Random variable, x
2
3
4
5
6
7
8
9
10
11 12
6
Frequency of
x,
n x
1
2
3
4
5
6
5
4
3
2
1
5
4
3
A histogram for this frequency distribution is shown in Figure C.19.
2
1
✓
x
CHECKPOINT 2
0
2
4
6
8
10
12
Use a graphing utility to create a histogram similar to the one shown in Figure
Random variable
C.19, representing the frequencies for tossing four coins. Let the random vari-
■
F I G U R E C . 1 9
able be the number of heads that turn up.
There are often many different values of
x,
so it is not feasible to list each
value in a frequency distribution. In such cases, you can construct a grouped
frequency distribution, as shown in Example 3.
ADVERTISEMENT
0 votes
Related Articles
Related forms


Related Categories
Parent category: Education