Probability Distributions Worksheets Page 5
ADVERTISEMENT
 1
1 2
2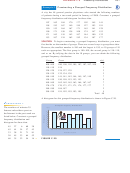 3
3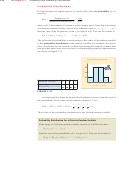 4
4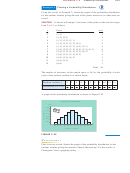 5
5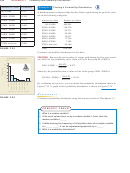 6
6 7
7 8
8A39
A P P E N D I X C . 5
Probability Distributions
Example 4
Finding a Probability Distribution
Using the results of Example 2, sketch the graph of the probability distribution
for the random variable giving the sum of the points when two six-sided dice are
tossed.
As shown in Example 2, the sums of the points on the two dice range
SOLUTION
from 2 to 12, as follows.
x
Event
n x
2
1, 1
1
3
1, 2 , 2, 1
2
4
1, 3 , 2, 2 , 3, 1
3
5
1, 4 , 2, 3 , 3, 2 , 4, 1
4
6
1, 5 , 2, 4 , 3, 3 , 4, 2 , 5, 1
5
7
1, 6 , 2, 5 , 3, 4 , 4, 3 , 5, 2 , 6, 1
6
8
2, 6 , 3, 5 , 4, 4 , 5, 3 , 6, 2
5
9
3, 6 , 4, 5 , 5, 4 , 6, 3
4
10
4, 6 , 5, 5 , 6, 4
3
11
5, 6 , 6, 5
2
12
6, 6
1
Total 36
The number of outcomes in the sample space is 36. So, the probability of each
value of the random variable is as shown below.
Random variable, x
2
3
4
5
6
7
8
9
10
11 12
1
2
3
4
5
6
5
4
3
2
1
Probability of x, P x
36
36
36
36
36
36
36
36
36
36
36
A graph of this probability distribution is shown in Figure C.22.
Probability Distribution
P(x)
0.18
0.15
0.12
0.09
0.06
0.03
x
2
3
4
5
6
7
8
9
10 11 12
Random variable
F I G U R E C . 2 2
✓
CHECKPOINT 4
Four coins are tossed. Sketch the graph of the probability distribution for the
random variable giving the number of heads that turn up. Use the results of
■
Checkpoint 2 and a graphing utility.
ADVERTISEMENT
0 votes
Related Articles
Related forms


Related Categories
Parent category: Education