Probability Distributions Worksheets Page 8
ADVERTISEMENT
 1
1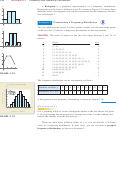 2
2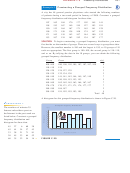 3
3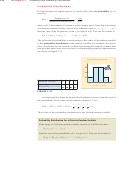 4
4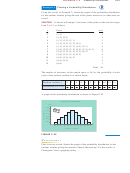 5
5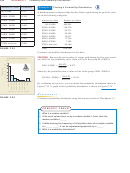 6
6 7
7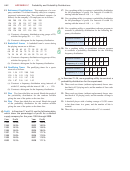 8
8A42
A P P E N D I X C
Probability and Probability Distributions
Retirement Contributions
17. Use a graphing utility to construct a probability distribution
12.
The employees of a com-
for the percentages of profit. Use intervals of width 0.5,
pany contribute 7% of their biweekly salary to a company-
starting with the interval
14.0 < x ≤ 14.5.
sponsored retirement plan. The contributed amounts (in
dollars) for the company’s 35 employees are as follows.
18. Use a graphing utility to construct a probability distribution
for the percentages of profit. Use intervals of width 1.0,
100 200 130 136 161 156 209
starting with the interval
14.0 < x ≤ 15.0.
126 135
98 114 117 168 133
140 124 172 127 143 157 124
19. Use a graphing utility or spreadsheet software program to
152 104 126 155
92 194 115
construct a probability distribution for the following fre-
120 136 148 112 116 146
96
quency distribution.
(a) Construct a frequency distribution using groups of 20,
with the first group
90 < x ≤ 110.
Random variable, x
1
2
3
4
5
6
(b) Construct a histogram for the frequency distribution.
2
4
6
6
4
2
Frequency of x, n x
Basketball Scores
13.
A basketball team’s scores during
the playing season are as follows.
20. Use a graphing utility or spreadsheet software program
54 68 50 65 61 72 58 55 46 69
to construct a probability distribution for the following
60 52 62 56 78 74 53 58 57 71
frequency distribution.
76 54 56 62 49 60 58 70 64 45
(a) Construct a frequency distribution using groups of five,
Random variable, x
2
3
4
5
6
7
with the first group
45 ≤ x < 50.
Frequency of x, n x
2
4
6
8
10
12
(b) Construct a histogram for the frequency distribution.
Qualifying Times
14.
The qualifying times for a sports
Random variable, x
8
9
10
11
12
event are as follows.
Frequency of x, n x
10
8
6
4
2
1.14 1.54 1.22 2.00 2.06
1.30 1.24 1.19 1.34 2.01
1.15 1.13 1.15 1.47 1.20
In Exercises 21–24, use a graphing utility to construct a
1.26 1.07 2.16 1.41 1.42
probability distribution for the experiment.
(a) Construct a frequency distribution using intervals of
21. Three cards are drawn (without replacement) from a stan-
width 0.2, starting with the interval
1.00 ≤ x < 1.20.
dard deck of 52 playing cards, and the number of face cards
(b) Construct a histogram for the frequency distribution.
is counted.
Dice
15.
Two four-sided dice are tossed. Sketch the graph of
22. Three cards are drawn (without replacement) from a stan-
the probability distribution for the random variable
dard deck of 52 playing cards, and the number of kings is
giving the sum of the points on the two dice.
counted.
Dice
16.
Three four-sided dice are tossed. Sketch the graph
23. A baseball player with a batting average of 0.330 comes
of the probability distribution for the random variable
to bat three times in a game, and the number of hits is
giving the sum of the points on the three dice.
counted.
24. Three dice are tossed and the number of 5’s is counted.
Profit
In Exercises 17 and 18, use the following data,
which show the percentages of profit for a medical
supply company for the years 1993 through 2008.
Year
Profit
Year
Profit
1993
15.9%
2001
15.6%
1994
14.9%
2002
14.9%
1995
14.5%
2003
15.6%
1996
14.6%
2004
18.4%
1997
17.1%
2005
17.7%
1998
15.8%
2006
17.0%
1999
16.0%
2007
17.8%
2000
15.5%
2008
17.1%
ADVERTISEMENT
0 votes
Related Articles
Related forms


Related Categories
Parent category: Education