Probability Distributions Worksheets Page 4
ADVERTISEMENT
 1
1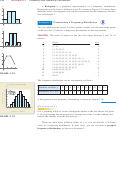 2
2 3
3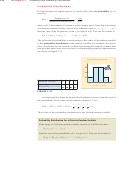 4
4 5
5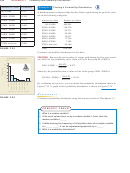 6
6 7
7 8
8A38
A P P E N D I X C
Probability and Probability Distributions
Probability Distributions
If each outcome in a sample space is equally likely, then the probability of is
S
x
given by
Frequency of x
n x
P x
Number of outcomes in S
n S
where
n S
is the number of outcomes in the sample space. Note that if the range
of a discrete random variable consists of
m
different values
x
, x
, x
, . . . , x
,
1
2
3
m
then the sum of the frequencies of the
x
is equal to
n S .
This can be written as
i
. . .
n x
n x
n x
n x
n S .
1
2
3
m
The collection of probabilities corresponding to the values of the random variable
is the probability distribution of the random variable. For example, the proba-
bility distribution for the random variable representing the number of heads that
turn up when three coins are tossed and a corresponding graphical representation
are shown in Figure C.21.
Probability Distribution
P(x)
3
8
1
4
1
8
x
Random variable, x
0
1
2
3
0
1
2
3
1
3
3
1
Random variable
Probability of x, P x
8
8
8
8
F I G U R E C . 2 1
An important fact about the probability distribution shown is that the sum of
the probabilities of the values of the random variable is 1. So,
1
3
3
1
P 0
P 1
P 2
P 3
1.
8
8
8
8
This is true of the probability distribution for any discrete random variable.
Probability Distribution for a Discrete Random Variable
If the range of a discrete random variable consists of
m
different values
x
, x
, x
, . . . , x
1
2
3
m
then the sum of the probabilities of
x
is equal to 1. This can be written as
i
. . .
P x
P x
P x
P x
1.
1
2
3
m
ADVERTISEMENT
0 votes
Related Articles
Related forms


Related Categories
Parent category: Education