Probability Distributions Worksheets Page 6
ADVERTISEMENT
 1
1 2
2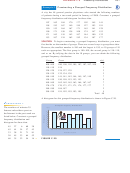 3
3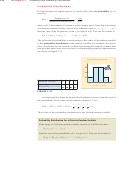 4
4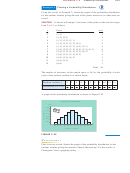 5
5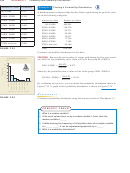 6
6 7
7 8
8A40
A P P E N D I X C
Probability and Probability Distributions
Example 5
Finding a Probability Distribution
Probability
Amount of Claim
$0 – $1000
0.477
A health insurance company finds that the claims it paid during the past five years
are in the following categories.
$1001 – $2000
0.184
Amount of claim
Number of claims
$2001 – $3000
0.111
$0–$1000
405,825
$3001 – $4000
0.069
$1001–$2000
156,330
$4001 – $5000
0.030
$2001–$3000
94,213
$3001–$4000
58,458
$5001 – $6000
0.020
$4001–$5000
25,913
$6001 – $7000
0.009
$5001–$6000
17,356
$6001–$7000
7,589
$7001 and over
0.099
$7001 and over
84,560
Total
850,244
F I G U R E C . 2 3
Construct a probability distribution for this data.
Because the total number of claims paid during the five-year period
SOLUTION
Probability Distribution
was 850,244, the probability that a claim will be in the group $0 – $1000 is
P(x)
405,825
0.5
P $0 – $1000
0.477.
850,244
0.4
Similarly, the probability that a claim will be in the group $1001 – $2000 is
0.3
0.2
156,330
P $1001 – $2000
0.184.
0.1
850,244
x
By continuing this process, you can obtain the probability distribution shown in
Figure C.23. A graph of this probability distribution is shown in Figure C.24.
Amount of claim (in dollars)
✓
CHECKPOINT 5
F I G U R E C . 2 4
■
Construct a probability distribution using the data and results of Checkpoint 3.
C O N C E P T C H E C K
1. What is a random variable?
2. If the set of values taken on by a random variable is finite, then the
random variable is ______.
3. A table showing the frequency of all possible values of a random variable
is a ______ ______. It can be represented graphically by a ______.
4. What is a probability distribution?
ADVERTISEMENT
0 votes
Related Articles
Related forms


Related Categories
Parent category: Education