Probability And Statistics Worksheets - Universiti Malaysia Perlis Page 6
ADVERTISEMENT
 1
1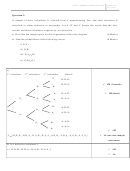 2
2 3
3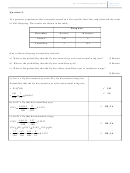 4
4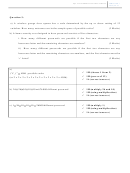 5
5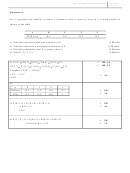 6
6EQT 272 PROBABILITY AND STATISTICS
SEMESTER 1
2012/2013
Question 4:
Let x represent the number of times a customer visits a grocery store in a 1-week period as
shown in the table.
x
0
1
2
3
P (X = x)
0.1
0.4
0.4
0.1
a) Find the expected value and variance of X.
(5 Marks)
b) Find the cumulative distribution function of X.
(2 Marks)
c) Find the probability that X is greater than 1.
(2 Marks)
d) Find P (1≤ X ≤3).
(2 Marks)
1M, 1A
E
(X
)
0
0 (
) 1 .
( 1
. 0
) 4
( 2
. 0
) 4
3
0 (
) 1 .
1
5 .
a)
1M, 1A
2
2
2
2
2
E
(
X
)
0
0 (
) 1 .
1
(
. 0
) 4
2
(
. 0
) 4
3
0 (
) 1 .
2
9 .
2
2
) – (E(X))
Variance = E(X
= 2.9 – (1.5)
2
1A
=0.65
b)
x
0
1
2
3
1M
P(X=x)
0.1
0.4
0.4
0.1
1A
F(X)
0.1
0.5
0.9
1
1M
c) P (X > 1) = P (X =2) + P (X = 3)
1A
= 0.4 + 0.1
= 0.5
d) P (1≤ X ≤3) = P(X=1) + P(X=2) + P(X=3)
1M
1A
= 0.4+0.4+0.1 = 0.9
ADVERTISEMENT
0 votes
Related Articles
Related forms


Related Categories
Parent category: Education