Scatter Plots Worksheet Page 2
ADVERTISEMENT
 1
1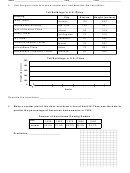 2
2Name
________________________________________
Date
___________________
Class
__________________
5.
Use the given data to make a scatter plot, and describe the correlation.
Tall Buildings in U.S. Cities
Tall Buildings in U.S. Cities
Tall Buildings in U.S. Cities
Tall Buildings in U.S. Cities
Building
City
Stories
Height (meters)
Sears Tower
Chicago
110
442
Empire State Building
New York
102
381
Bank of America Plaza
Atlanta
55
312
Library Tower
Los Angeles
75
310
Key Tower
Cleveland
57
290
Columbia Seafirst Center
Seattle
76
287
NationsBank Plaza
Dallas
72
281
NationsBank Corporate Center
Charlotte
60
265
Tall Buildings in U.S. Cities
500
400
300
200
100
0
Stories
Describe the correlation: _________________________________
6. Make a scatter plot of the data, and draw a line of best fit. Then use the data to
predict the percentage of American homeowners in 1955.
Percent of Americans Owning Homes
Percent of Americans Owning Homes
Percent of Americans Owning Homes
Percent of Americans Owning Homes
Percent of Americans Owning Homes
Percent of Americans Owning Homes
Year
1950
1960
1970
1980
1990
Percent
55.0% 61.9% 62.9% 64.4%
64.2%
Prediction: ___________________
ADVERTISEMENT
0 votes
Related Articles
Related forms


Related Categories
Parent category: Business