Periodic Trends Lab Page 4
ADVERTISEMENT
 1
1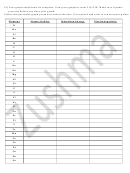 2
2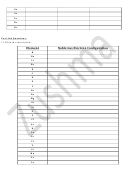 3
3 4
4Ni
Cu
Zn
Ga
Ge
As
Se
Br
Kr
2) On each graph label the peaks and valleys with the symbol or name of the element.
3) On the graph of Atomic Number vs. Atomic Radius, describe the periodic trend in 1‐2 sentences. Give
a plausible explanation based on the electron configurations. Note any discrepancies that you notice in
the trend.
4) On the graph of Atomic Number vs. Electronegativity, describe the periodic trend in 1‐2 sentences.
Give a plausible explanation based on the electron configurations. Note any discrepancies that you notice
in the trend.
5) On the graph of Atomic Number vs. Ionization Energy, describe the periodic trend in 1‐2 sentences.
Give a plausible explanation based on the electron configurations. Note any discrepancies that you notice
in the trend.
6) Examine the electron configurations in Post Lab #1. What is the relationship between an element’s
placement within a group and its electron configuration?
7) Why does an atom get larger as you go from top to bottom with a group?
8) Why does an atom get smaller as you go across the periodic table from left to right?
9) Is the pattern of atomic radius absolute or generally true?
10) Why does ionization energy get lower as you go from top to bottom of a group?
11) Why does ionization energy get higher as you go across the periodic table from left to right?
12) Why does electronegativity get lower as you go from top to bottom of a group?
13) Why does electronegativity get higher as you go across the periodic table from left to right?
14) Based on your graphs: which element is the greatest
a) atomic radius
b) electronegativity
c) ionization energy
ADVERTISEMENT
0 votes
Related Articles
Related forms


Related Categories
Parent category: Education