Reading A Solubility Chart Page 4
ADVERTISEMENT
 1
1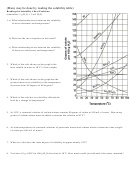 2
2 3
3 4
418. Are the following solutions saturated, unsaturated or supersaturated (assume that all three could form
supersaturated solutions)
o
a. 40. g of KCl in 100 mL of water at 80
C
o
b. 120. g of KNO
in 100 g of water at 60
C
3
o
c. 80. g of NaNO
in 100 mL of water at 10
C
3
d.
160. g of NaNO
in 200 g of water at 20 C
3
19. What would happen if a saturated solution of potassium chloride, KCl, in 100g of water was cooled from
80°C to 40°C?
20. You start with a saturated solution of NH
in 100 mL of water at 10°C. How many grams of NH
gas would
3
3
bubble out of the solution if you raise the temperature to 80°C?
21. A saturated solution of KNO
in 400 grams of water at 50°C is cooled to 10°C. How much KNO
will come
3
3
out of the solution as crystals?
22. The salinity levels of the world’s oceans generally increase as you get closer to the equator and decrease
as you move away from the equator. Suggest an explanation for this phenomenon.
23. The above solubility curve represents the solubility of solids in a liquid as temperature increases. Would
you expect a solubility curve representing the solubility of gases in a liquid as temperature increase to
display the same trend? Why or why not?
ADVERTISEMENT
0 votes
Related Articles
Related forms


Related Categories
Parent category: Education