Rrevision Guide Organic Analysis
ADVERTISEMENT
 1
1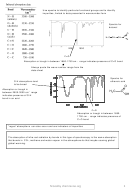 2
2 3
33.6 Analysis
Mass Spectrometry
The peak with the highest
Mass spectrum for butane
mass/charge ratio will be normally
When organic molecules are
due to the original molecule that
passed through a mass
43
hasn’t fragmented (called the
spectrometer, it detects both
molecular ion) . As the charge of
the whole molecule and
the ion is +1 the mass/ charge ratio
fragments of the molecule
is equal to Mr.
29
C
H
= 58
4
10
Definition: molecular ion is the molecule with one electron
+.
–
Molecular ion formed:
M → [M]
+ e
knocked off (It is both an ion and a free radical)
High resolution mass
High resolution mass spectrometry can be used to determine the molecular
spectroscopy can measure the
formula of a compound from the accurate mass of the molecular ion
mass to 5 d.p. This can help
differentiate between compounds
that appear to have similar Mr (to
For example, the following molecular formulas all have a rough M
of 60,
r
the nearest whole number)
but a more precise M
can give the molecular formula.
r
e.g.
M
= 60.02112 molecular formula = C
H
O
Accurate masses of atoms:
r
2
4
2
H = 1.0078
M
= 60.05751 molecular formula = C
H
O
r
3
8
C = 12.0000
M
= 60.03235 molecular formula = CH
N
O
O = 15.9949
r
4
2
N = 14.0031
Carbon has a value of 12.0000 as it is by definintion the standard reference
Example 1
A compound is found to have an accurate relative formula mass of 46.0417. It is thought to be either CH
CH
OH
3
2
or H
NCH
NH
. Calculate the M
of each compound to 4 decimal places to work out which one it is.
2
2
2
r
CH
CH
OH = (12.0000 x 2) + (15.9949 x 1) + (1.0078 x6) = 46.0417
3
2
H
NCH
NH
. = (12.0000 x 1) + (14.0031 x 2) + (1.0078 x6) = 46.0530
2
2
2
Infrared spectroscopy
Complicated spectra can be obtained than
Certain groups in a molecule absorb infra-red
provide information about the types of bonds
radiation at characteristic frequencies
present in a molecule
-1
Above 1500 cm
– “Functional group identification”
-1
Below 1500 cm
– “Fingerprinting”
Complicated and contains many
signals – picking out functional group
signals difficult.
This part of the spectrum is unique for
every compound, and so can be used
as a "fingerprint".
A computer will compare the IR
spectra against a database of known
Use an IR absorption table provided in exam
pure compounds to identify the
to deduce presence or absence of particular
compound
bonds or functional groups
N Goalby
1
-1
e.g. C=O 1680 – 1750 cm
-1
O-H (acid) 2500- 3000 cm
ADVERTISEMENT
0 votes
Related Articles
Related forms


 - Summary Of The Major Substantive Changes Proposed For The Scoping And Technical Requirements")


Related Categories
Parent category: Education