Quality Improvement Plan Template Page 13
ADVERTISEMENT
 1
1 2
2 3
3 4
4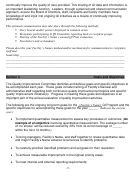 5
5 6
6 7
7 8
8 9
9 10
10 11
11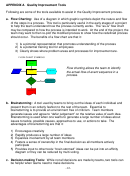 12
12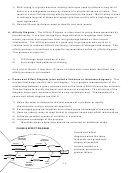 13
13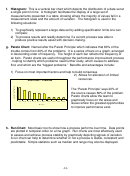 14
14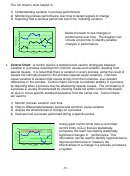 15
15 16
161) Multi-voting is a group decision-making technique used to reduce a long list of
items to a manageable number by means of a structured series of votes. The
result is a short list identifying what is important to the team. Multi-voting is used
to reduce a long list of ideas and assign priorities quickly with a high degree of
team agreement.
2) Nominal Group technique-used to identify and rank issues.
d. Affinity Diagram: The Affinity Diagram is often used to group ideas generated by
brainstorming. It is a tool that gathers large amounts of language data (ideas,
issues, opinions) and organizes them into groupings based on their natural
relationship. The affinity process is a good way to get people who work on a
creative level to address difficult, confusing, unknown or disorganized issues. The
affinity process is formalized in a graphic representation called an affinity diagram.
This process is useful to:
1)
Sift through large volumes of data.
2)
Encourage new patterns of thinking.
As a rule of thumb, if less than 15 items of information have been identified, the
affinity process is not needed.
e. Cause and Effect Diagram (also called a fishbone or Ishakawa diagram): This
is a tool that helps identify, sort, and display. It is a graphic representation of the
relationship between a given outcome and all the factors that influence the outcome.
This tool helps to identify the basic root causes of a problem. The structure of the
diagram helps team members think in a very systematic way. The benefits of a
cause-and-effect diagram are that it:
1) Helps the team to determine the root causes of a problem or quality
characteristic using a structured approach
2) Encourages group participation and utilizes group knowledge of the process
3) Uses an orderly, easy-to-read format to diagram cause-and-effect relationships
4) Indicates possible causes of variation in a process
5) Increases knowledge of the process
6)
Identifies areas where data should be collected for additional study.
CAUSE & EFFECT DIAGRAM
Cause and effect
diagrams allow the team
POLICIES &
to identify and graphically
PROCEDURES
PHYSICAL
(PROCESSES)
ENVIRONMENT
display all possible
conflicting policies
Unsafe conditions
causes related to a
No policies present
Security problems
process, procedure or
inadequate policies
Undesired
system failure.
Outcome
Human Error
not available
Staffing
Competency
Insufficient supplies
Human
Resources
OTHER
-13-
SUPPLIES,
AREAS
EQUIPMENT &
MATERIALS
ADVERTISEMENT
0 votes
Related Articles
Related forms


Related Categories
Parent category: Business