Financial Statement Analysis Page 14
ADVERTISEMENT
 1
1 2
2 3
3 4
4 5
5 6
6 7
7 8
8 9
9 10
10 11
11 12
12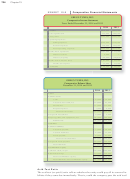 13
13 14
14 15
15 16
16 17
17 18
18 19
19 20
20 21
21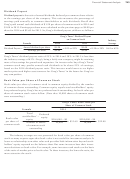 22
22 23
23 24
24 25
25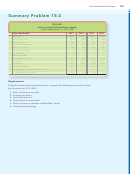 26
26 27
27 28
28 29
29 30
30 31
31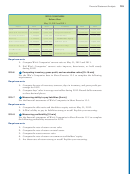 32
32 33
33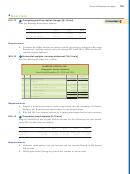 34
34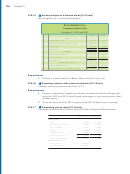 35
35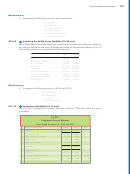 36
36 37
37 38
38 39
39 40
40 41
41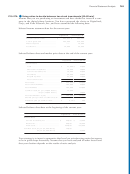 42
42 43
43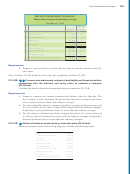 44
44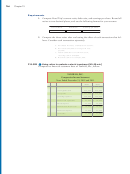 45
45 46
46 47
47 48
48 49
49 50
50 51
51Financial Statement Analysis
735
To compute the acid-test ratio, we add cash, short-term investments (those that
may be sold in the lesser of 12 months or the business operating cycle), and net cur-
rent receivables (accounts and notes receivable, net of allowances) and divide this
sum by current liabilities. Inventory and prepaid expenses are not included in the
acid test because they are the least-liquid current assets. Greg’s Tunes’ acid-test
ratios for 2014 and 2013 follow:
Greg’s Tunes’ Acid-Test Ratio
Industry
Formula
2014
2013
Average
Cash + Short-term
investments
+ Net current
$29,000 + $0
$32,000 + $0
receivables
+ $114,000
+ $85,000
Acid-test
=
= 1.01
= 0.93
0.46
ratio
Current liabilities
$142,000
$126,000
The company’s acid-test ratio improved during 2014 and is significantly better than
the industry average. The norm for the acid-test ratio ranges from 0.20 for shoe retail-
ers to 1.00 for manufacturers of equipment, as reported by the Risk Management
Association. An acid-test ratio of 0.90 to 1.00 is acceptable in most industries.
Evaluating the Ability to Sell Inventory
and Collect Receivables
In this section, we discuss five ratios that measure the company’s ability to sell
inventory and collect receivables.
Inventory Turnover
The inventory turnover ratio measures the number of times a company sells its aver-
age level of inventory during a year. A high rate of turnover indicates ease in selling
inventory; a low rate indicates difficulty. A value of 4 means that the company sold
its average level of inventory four times—once every three months—during the year.
If the company were a seasonal company, this would be a good ratio because it
would mean it turned its inventory over each season, on average.
To compute inventory turnover, we divide cost of goods sold by the average
inventory for the period. We use the cost of goods sold—not sales—because both
cost of goods sold and inventory are stated at cost. Sales at retail are not compara-
ble with inventory at cost.
Greg’s Tunes’ inventory turnover for 2014 is as follows:
Greg’s Tunes’
Industry
Formula
Inventory Turnover
Average
Cost of goods sold
$513,000
Inventory turnover =
= 4.6
27.7
Average inventory
$112,000
Cost of goods sold comes from the income statement (Exhibit 15-8). Average inven-
tory is figured by adding the beginning inventory of $111,000 to the ending inven-
tory of $113,000 and dividing by 2. (See the balance sheet, Exhibit 15-8.)
Inventory turnover varies widely with the nature of the business. For example,
most manufacturers of farm machinery have an inventory turnover close to three
times a year. In contrast, companies that remove natural gas from the ground hold
their inventory for a very short period of time and have an average turnover of 30.
Greg’s Tunes’ turnover of 4.6 times a year means on average the company has
ADVERTISEMENT
0 votes
Related Articles
Related forms


Related Categories
Parent category: Financial