Financial Statement Analysis Page 35
ADVERTISEMENT
 1
1 2
2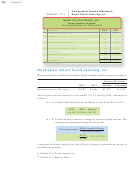 3
3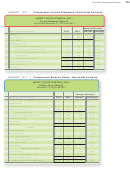 4
4 5
5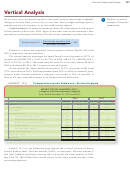 6
6 7
7 8
8 9
9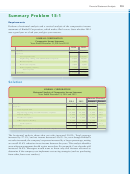 10
10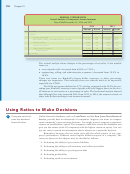 11
11 12
12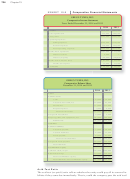 13
13 14
14 15
15 16
16 17
17 18
18 19
19 20
20 21
21 22
22 23
23 24
24 25
25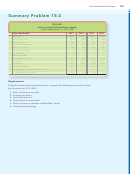 26
26 27
27 28
28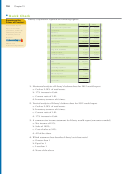 29
29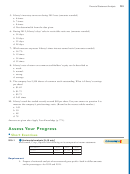 30
30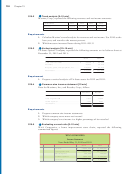 31
31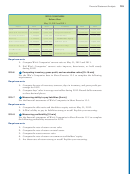 32
32 33
33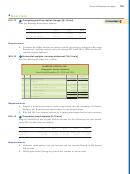 34
34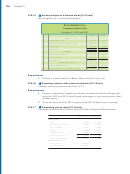 35
35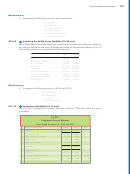 36
36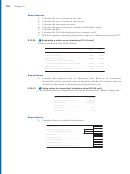 37
37 38
38 39
39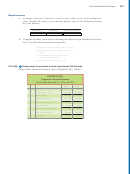 40
40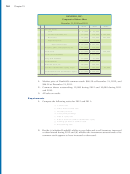 41
41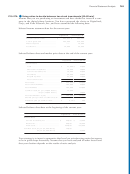 42
42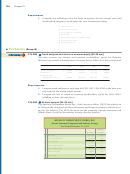 43
43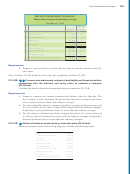 44
44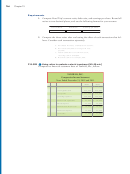 45
45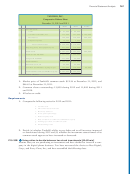 46
46 47
47 48
48 49
49 50
50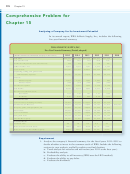 51
51756
Chapter 15
E15-15
Vertical analysis of a balance sheet [10–15 min]
2
Beta Graphics, Inc., has the following data:
BETA GRAPHICS, INC.
Comparative Balance Sheet
December 31, 2012 and 2011
2012
2011
Assets
Total current assets
$
42,750
$
59,000
Property, plant, and equipment, net
208,335
215,000
Other assets
33,915
35,500
Total assets
$ 285,000
$ 309,500
Liabilities
Total current liabilities
$
49,020
$
50,100
Long-term debt
109,155
102,300
Total liabilities
$ 158,175
$ 152,400
Stockholders’ Equity
Total stockholders’ equity
126,825
157,100
Total liabilities and stockholders’ equity
$ 285,000
$ 309,500
Requirement
1. Perform a vertical analysis of Beta’s balance sheet for each year.
E15-16
Preparing common-size income statements [10–15 min]
3
Consider the data presented in Exercise 15-13.
Requirements
1. Prepare a comparative common-size income statement for Mariner Designs, Inc.,
using the 2012 and 2011 data. Round percentages to one-tenth percent (three
decimal places).
2. To an investor, how does 2012 compare with 2011? Explain your reasoning.
E15-17
Computing six key ratios [10–15 min]
4
The financial statements of Victor’s Natural Foods include the following items:
Current Year
Preceding Year
Balance sheet:
Cash . . . . . . . . . . . . . . . . . . . . .
$
15,000
$
20,000
Short-term investments . . . . . .
11,000
27,000
Net receivables . . . . . . . . . . . . .
54,000
73,000
Inventory . . . . . . . . . . . . . . . . .
77,000
69,000
Prepaid expenses . . . . . . . . . . .
15,000
9,000
Total current assets . . . . . . . . .
$
172,000
$
198,000
Total current liabilities . . . . . . .
$
133,000
$
93,000
Income statement:
Net credit sales . . . . . . . . . . . . .
$
462,000
Cost of goods sold . . . . . . . . . .
315,000
ADVERTISEMENT
0 votes
Related Articles
Related forms


Related Categories
Parent category: Financial