Financial Statement Analysis Page 34
ADVERTISEMENT
 1
1 2
2 3
3 4
4 5
5 6
6 7
7 8
8 9
9 10
10 11
11 12
12 13
13 14
14 15
15 16
16 17
17 18
18 19
19 20
20 21
21 22
22 23
23 24
24 25
25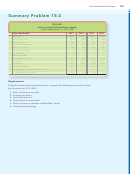 26
26 27
27 28
28 29
29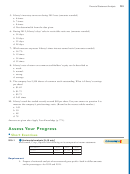 30
30 31
31 32
32 33
33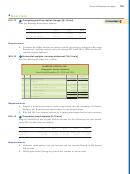 34
34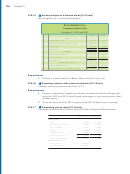 35
35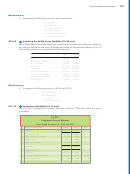 36
36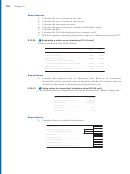 37
37 38
38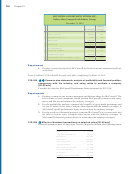 39
39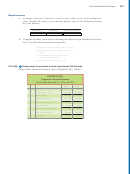 40
40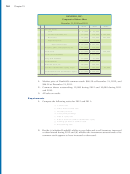 41
41 42
42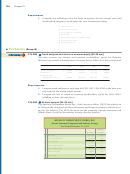 43
43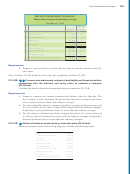 44
44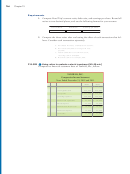 45
45 46
46 47
47 48
48 49
49 50
50 51
51Financial Statement Analysis
755
Exercises
E15-12
Computing working capital changes [5–15 min]
1
Data for Beverage Enterprises follows:
2012
2011
2010
Total current assets . . . . . .
$510,000
$ 350,000
$240,000
Total current liabilities . . . .
245,000
175,000
120,000
Requirement
1. Compute the dollar amount of change and the percentage of change in Beverage
Enterprises’ working capital each year during 2011 and 2012. What do the cal-
culated changes indicate?
E15-13
Horizontal analysis—income statement [10–15 min]
1
Data for Mariner Designs, Inc., follow:
MARINER DESIGNS, INC.
Comparative Income Statement
Years Ended December 31, 2012 and 2011
2012
2011
Net sales revenue
$ 431,000
$ 372,350
Expenses:
Cost of goods sold
$ 200,000
$ 187,550
Selling and general expenses
99,000
91,050
Other expense
8,350
6,850
Total expenses
$ 307,350
$ 285,450
$ 123,650
$
86,900
Net income
Requirements
1. Prepare a horizontal analysis of the comparative income statement of Mariner
Designs, Inc. Round percentage changes to one decimal place.
2. Why did 2012 net income increase by a higher percentage than net sales revenue?
E15-14
Computing trend analysis [5–10 min]
1
Magic Oaks Realty’s net revenue and net income for the following five-year period,
using 2010 as the base year, follow:
2014
2013
2012
2011
2010
Net revenue . . . . . . .
$1,310,000
$1,187,000
$1,110,000
$1,011,000
$1,045,000
Net income . . . . . . . .
122,000
113,000
84,000
72,000
83,000
Requirements
1. Compute trend analysis for net revenue and net income. Round to the nearest
full percent.
2. Which grew faster during the period, net revenue or net income?
ADVERTISEMENT
0 votes
Related Articles
Related forms


Related Categories
Parent category: Financial